Litecoin Price Analysis: LTC ready to shoot above $60 as network usage skyrocketing
- LTC/USD has settled above a significant technical barrier.
- On-chain metrics imply that the price is positioned for further growth.

Litecoin (LTC) is the 8th largest digital asset with a current market capitalization of $3.8 billion and an average daily trading volume of $3.7 billion. The coin has gained over 23% in the last seven days, becoming the best-performing cryptocurrency out of top-10 on a week-on-week basis,
The coin topped at $59.9 on October 25 before the upside momentum started fading away. At the time of writing, LTC/USD is changing hands at $56.9, mostly unchanged on a day-to-day basis; it is moving within the short-term bearish bias amid high volatility.
LTC/USD: Bullish trend gaining traction
Despite the retreat from the recent high, LTC is in a good position to continue the recovery as long as it stays above $56.8. This barrier that served as a local resistance during the weekend now turned into strong support that has the potential to limit the downside correction. On the intraday charts, it is also reinforced by the lower line of the Bollinger band and the 1-hour EMA100.
LTC/USD 1-hour
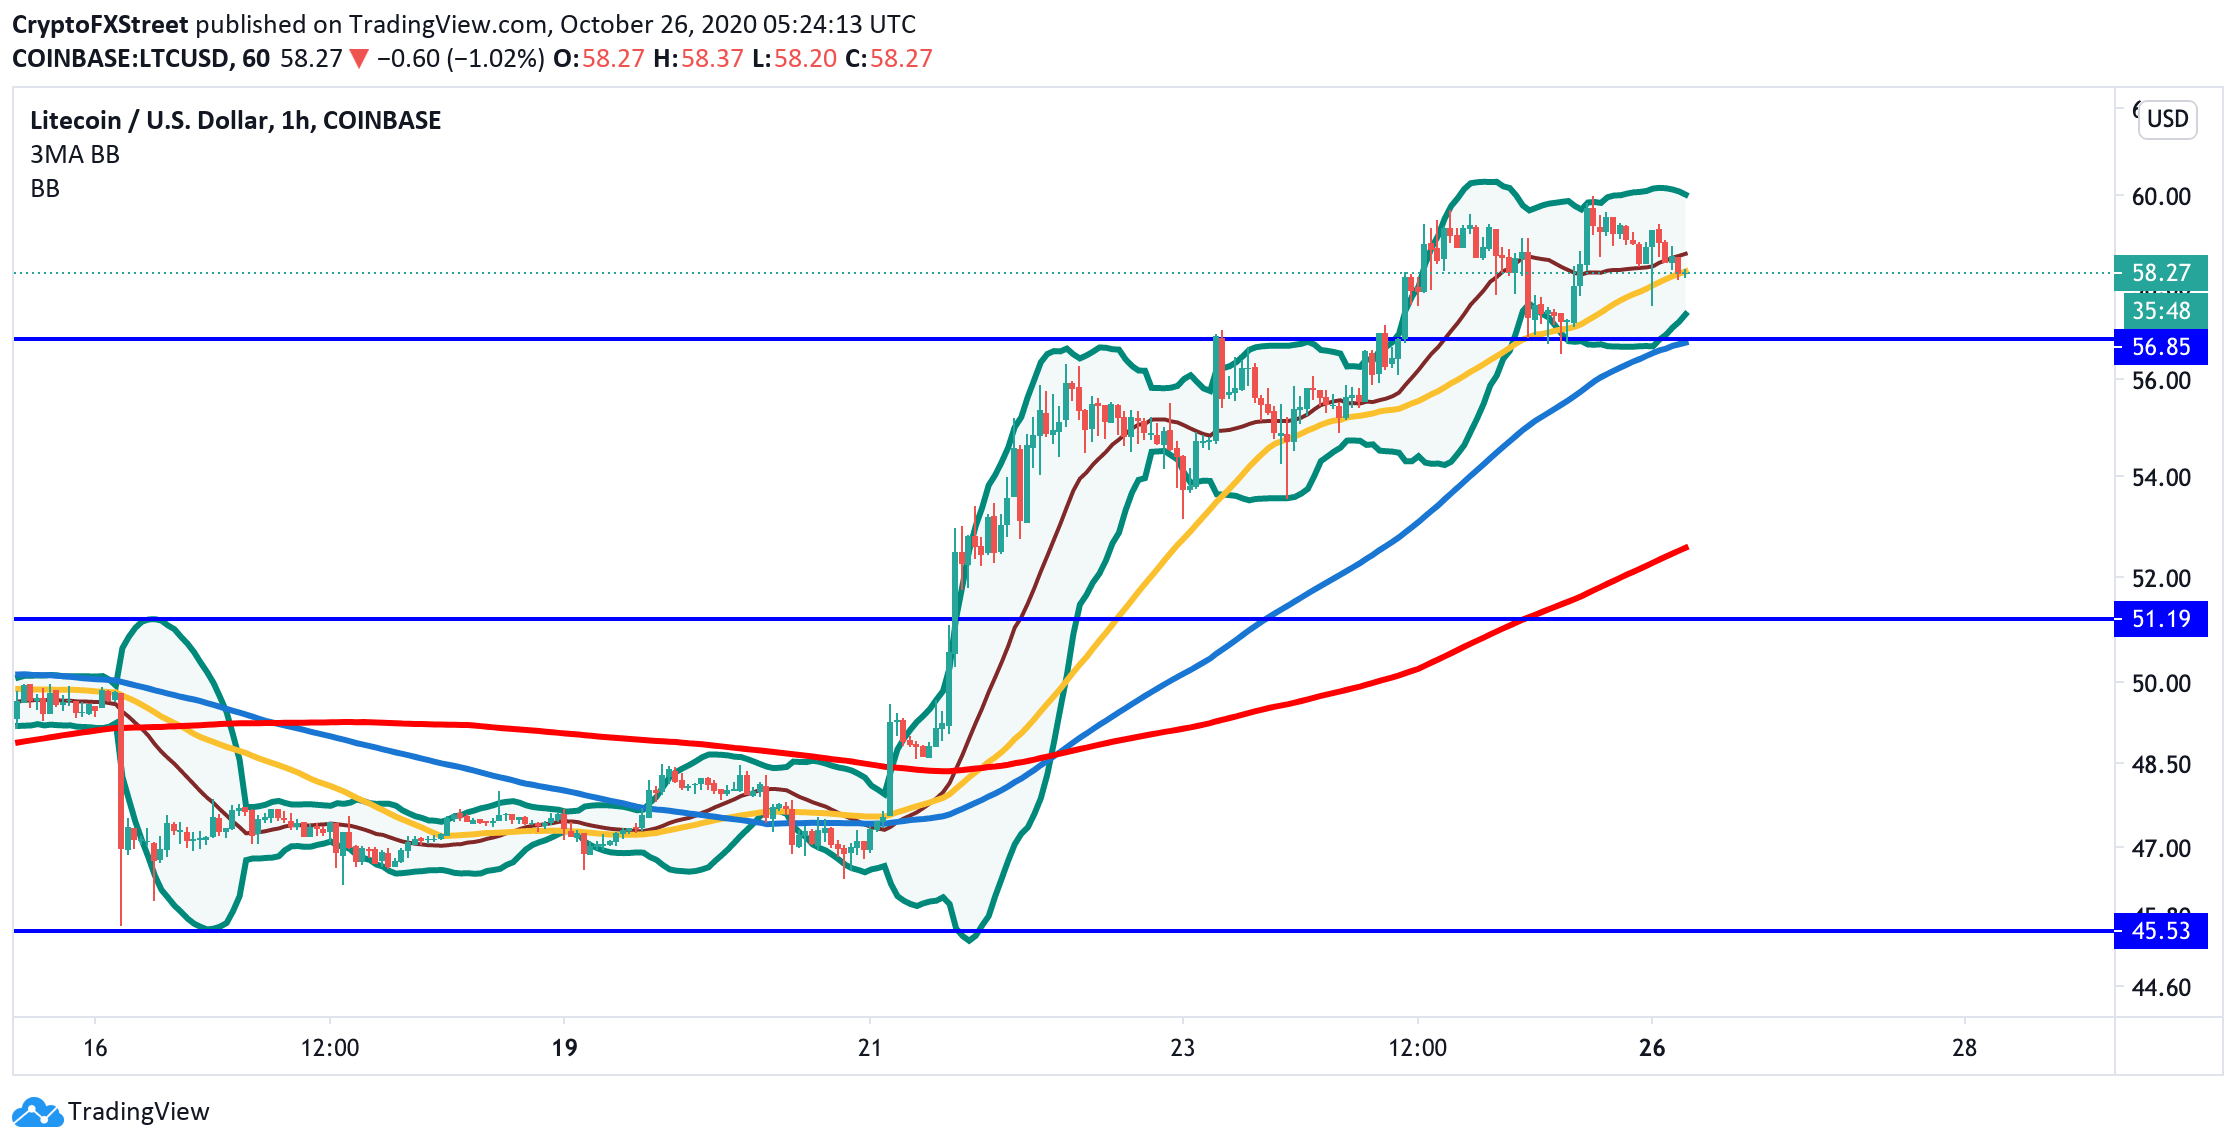
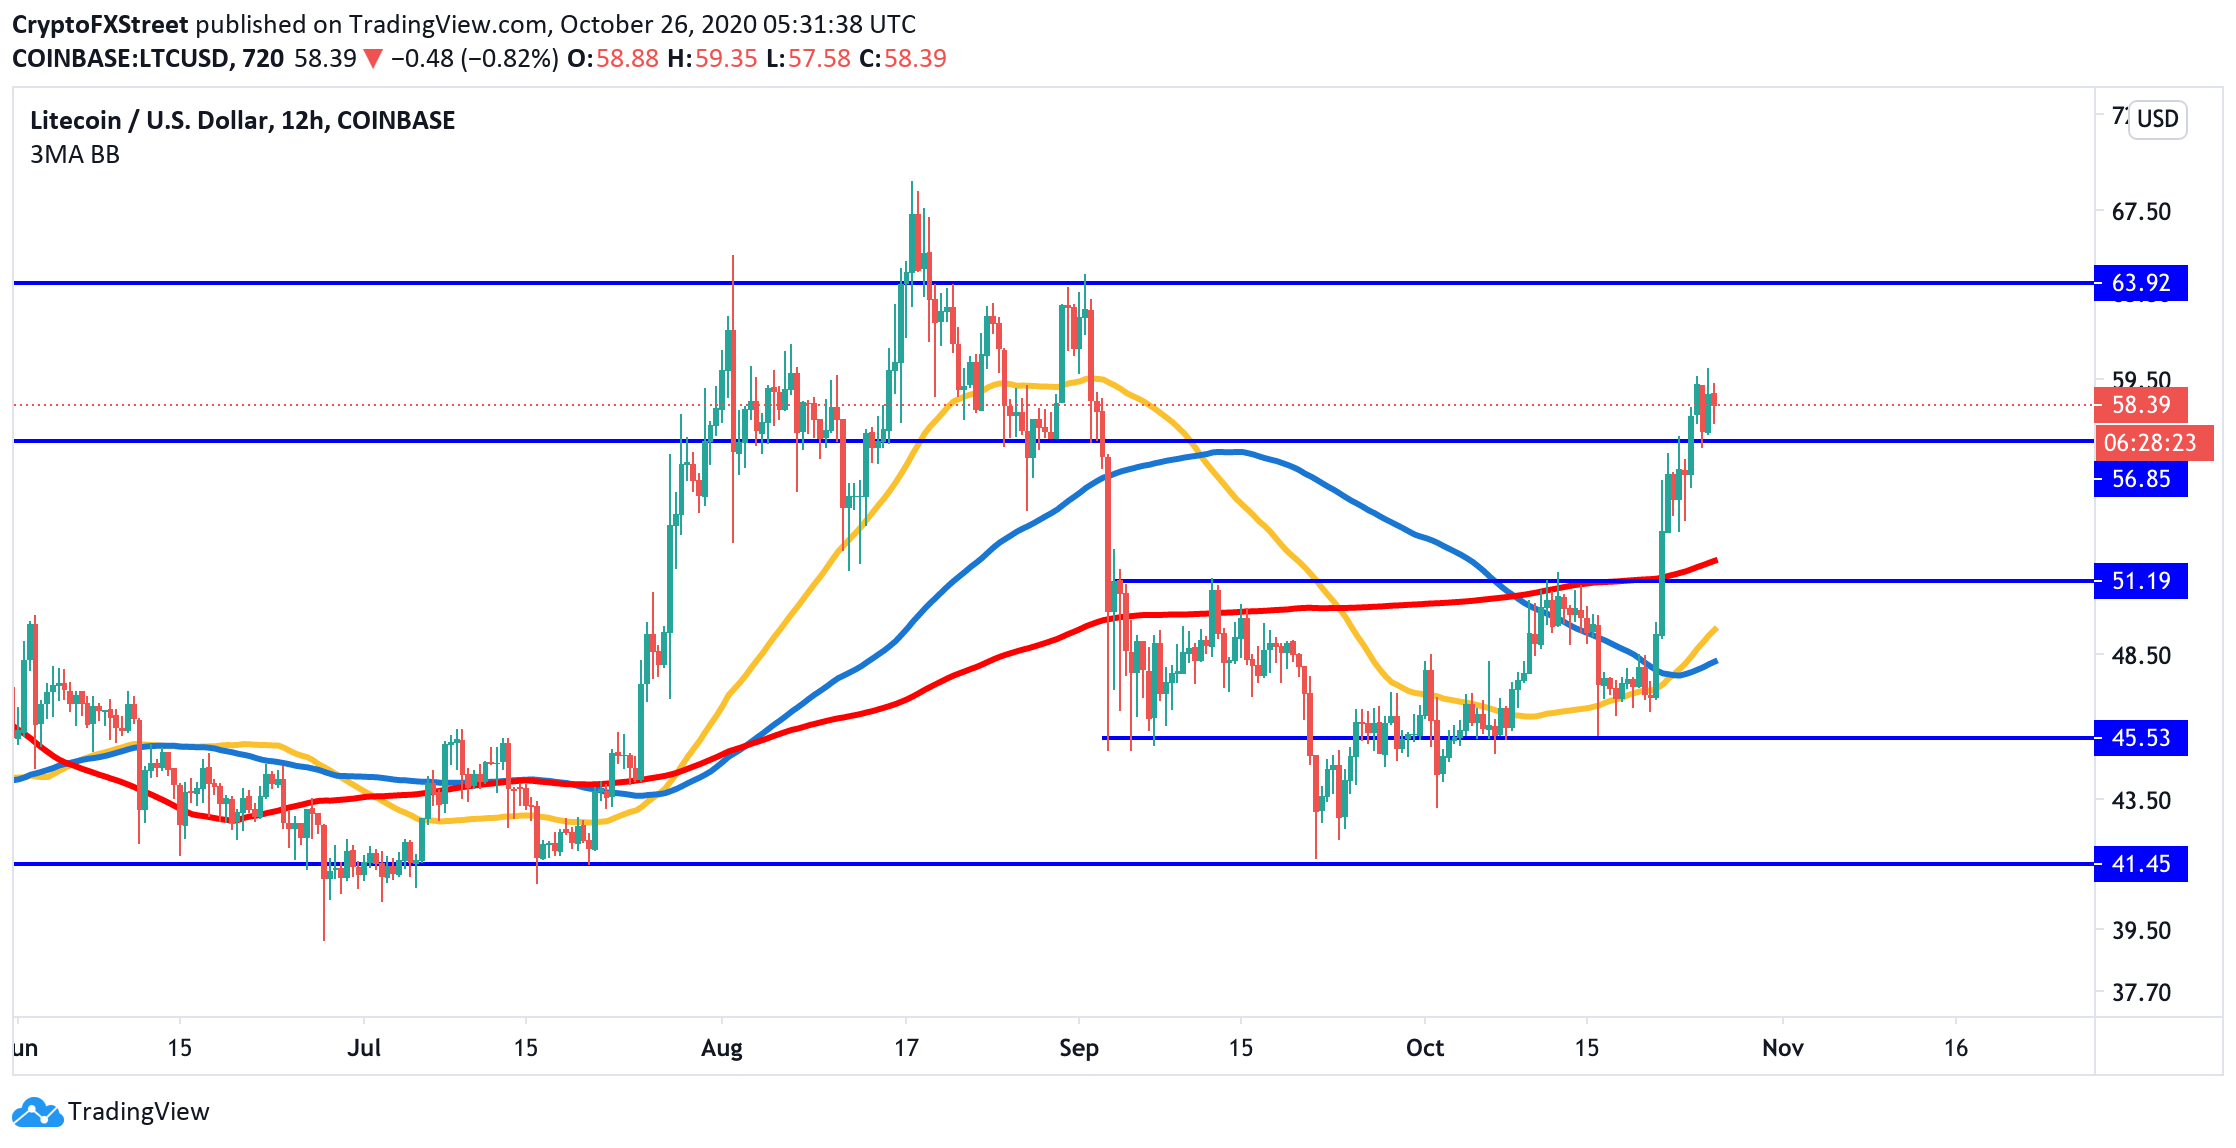
If this support area is broken, the sell-off may gain traction with the next focus on an approach to $51. This level served as a significant resistance for the coin in September and for most of October until it was broken on October 21. The next crucial bearish target comes at $45.5, followed by $41.5.
Meanwhile, if $56.8 is verified as support, LTC/USD may continue growing with the next focus on the psychological barrier of $60 strengthened by the recent high and the upper line of the 1-hour Bollinger Band. Once it is out of the way, the upside is likely to gain traction with the next focus on $64. This resistance stopped the coin's recovery in August.
LTC/USD 12-hour chart
LTC on-chain metrics
The coin-chain supports the bullish scenario. According to Glassnode, the number of active LTC addresses has grown by over 15% in the past 24 hours, from 6,596.062 to 7,594.896, meaning that the active participation in Litecoin's network in on the rise.
The greater usage usually implies that demand for the cryptocurrency is growing, which is a bullish signal for the price.
$LTC Number of Active Addresses (2d MA) increased significantly in the last 24 hours.
— glassnode alerts (@glassnodealerts) October 26, 2020
Current value is 7,594.896 (up 15.1% from 6,596.062)
View metric:https://t.co/K3UGNbPu1T pic.twitter.com/hDVP5sIAdE
Meanwhile, the In and Out of the Money Positioning (IOMP) data confirm a strong resistance on approach to $60. A cluster of 74,000 addresses holding over 2.6 million coins has their breakeven point there, meaning that the bulls may have a hard time pushing through. However, once it is broken, the way to the north will be mostly clear.
On the downside, the supply area of $56-$54 confirms the strength of the above-mentioned technical support of $56.8. Over 81,000 addresses folding 2.7 million coins are going to defend their breakeven there. The next supply wall is seen around $51, which coincides with the technical barrier mentioned above.
Litecoin's IOMP data
 Analytics and Charts2610-637392892082600782.png)
Source: Intotheblock
Key levels to watch
Technical and on-chain data implies that LTC is well-positioned for further growth; however, we will need to see the recovery above $60 for the upside to gain traction. A sustainable move above this will signal that the short-term bullish trend is back on track.
The downside correction will be limited by the former resistance of $56.8, while a sustainable move below this area will invalidate the immediate bullish scenario and bring $51 into focus.
Author

Tanya Abrosimova
Independent Analyst



