Litecoin Price Analysis: A bull pennant on hourly chart suggests further upside


  • Litecoin extends Saturday’s rebound.
  • $45.30 eyed amid a potential bull pennant formation.
  • Golden cross pattern spotted on the hourly chart.

The sixth most widely traded cryptocurrency, Litecoin (LTC/USD), with a market capitalization of $2.85 billion, is one of the top performers amongst the top 10 favorite digital assets so far this Sunday. The coin has resumed the recent bullish momentum, reversing Friday’s temporary correction. At the press time, LTC/USD is consolidating the latest uptick to 44.31 highs, up nearly 2% to trade around 44.10.

LTC/USD 1-hour chart


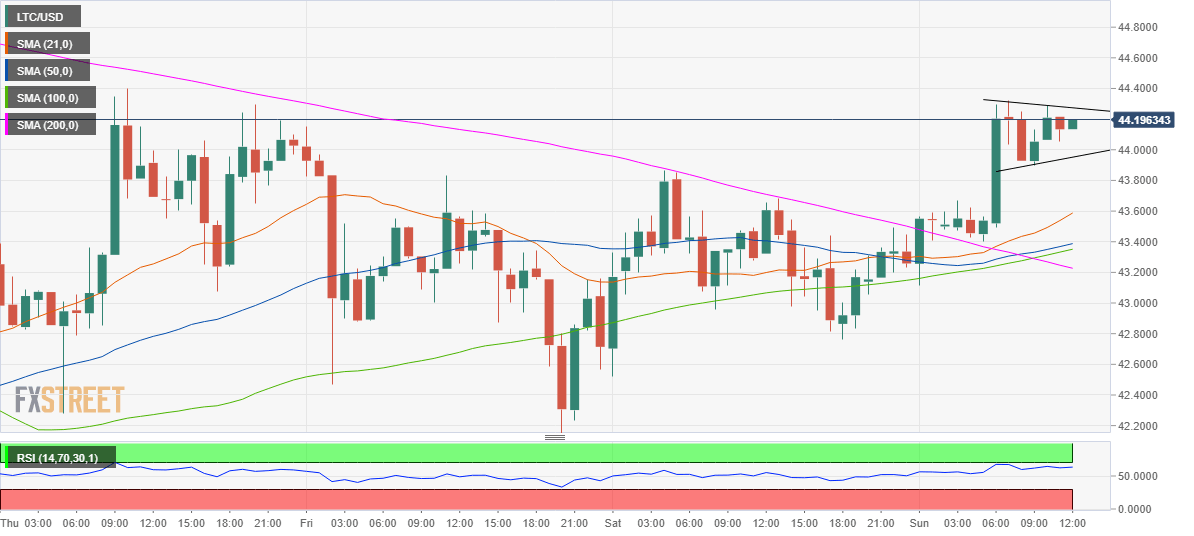
The price is trending higher but within a range inside a pennant formation, with the pole seen from 43.40 to 44.30.

A bullish breakout would imply a continuation of the recent upbeat momentum, with 45.30, the pattern target on the buyers’ radar.

The renewed upside in the spot gained traction after the 50-hourly Simple Moving Average (HMA) crossed the 200-HMA from below, charting a golden cross pattern.

Also, the hourly Relative Strength Index (RSI) is sitting comfortably above the midline, pointing towards more gains.

Should the bulls face rejection at the falling trendline resistance at 44.30, the coin could retrace towards the rising trendline support at 43.93.

A break below the latter would invalidate the formation, with the next support seen at the upward sloping 21-HMA of 43.53.

If the bears take out the 21-HMA support, the 43.00 round figure would come into play.

LTC/USD additional technical levels

LTC/USD

Overview
Today last price 44.1010
Today Daily Change 0.8417
Today Daily Change % 1.95
Today daily open 43.258
 
Trends
Daily SMA20 45.4991
Daily SMA50 43.3521
Daily SMA100 50.6602
Daily SMA200 51.2622
 
Levels
Previous Daily High 43.8635
Previous Daily Low 42.5175
Previous Weekly High 46.971
Previous Weekly Low 39.3673
Previous Monthly High 50.8723
Previous Monthly Low 37.1813
Daily Fibonacci 38.2% 43.3493
Daily Fibonacci 61.8% 43.0317
Daily Pivot Point S1 42.5626
Daily Pivot Point S2 41.8671
Daily Pivot Point S3 41.2167
Daily Pivot Point R1 43.9085
Daily Pivot Point R2 44.5589
Daily Pivot Point R3 45.2544


Information on these pages contains forward-looking statements that involve risks and uncertainties. Markets and instruments profiled on this page are for informational purposes only and should not in any way come across as a recommendation to buy or sell in these assets. You should do your own thorough research before making any investment decisions. FXStreet does not in any way guarantee that this information is free from mistakes, errors, or material misstatements. It also does not guarantee that this information is of a timely nature. Investing in Open Markets involves a great deal of risk, including the loss of all or a portion of your investment, as well as emotional distress. All risks, losses and costs associated with investing, including total loss of principal, are your responsibility. The views and opinions expressed in this article are those of the authors and do not necessarily reflect the official policy or position of FXStreet nor its advertisers. The author will not be held responsible for information that is found at the end of links posted on this page.

If not otherwise explicitly mentioned in the body of the article, at the time of writing, the author has no position in any stock mentioned in this article and no business relationship with any company mentioned. The author has not received compensation for writing this article, other than from FXStreet.

FXStreet and the author do not provide personalized recommendations. The author makes no representations as to the accuracy, completeness, or suitability of this information. FXStreet and the author will not be liable for any errors, omissions or any losses, injuries or damages arising from this information and its display or use. Errors and omissions excepted.

The author and FXStreet are not registered investment advisors and nothing in this article is intended to be investment advice.

Join Telegram

Recommended content


Recommended Content

Editors’ Picks

SEC doubles down on TRON's Justin Sun lawsuit dismissing claims over jurisdiction

SEC doubles down on TRON's Justin Sun lawsuit dismissing claims over jurisdiction

The SEC says it has jurisdiction to bring Justin Sun to court as he traveled extensively to the US. Sun asked to dismiss the suit, arguing that the SEC was targeting actions taken outside the US.

More TRON News

XRP fails to break past $0.50, posting 20% weekly losses

XRP fails to break past $0.50, posting 20% weekly losses

XRP trades range-bound below $0.50 for a sixth consecutive day, accumulating 20% losses in the last seven days. Ripple is expected to file its response to the SEC’s remedies-related opening brief by April 22. 

More Ripple News

ImmutableX extends recovery despite $69 million IMX token unlock

ImmutableX extends recovery despite $69 million IMX token unlock

ImmutableX unlocked 34.19 million IMX tokens worth over $69 million early on Friday. IMX circulating supply increased over 2% following the unlock. The Layer 2 blockchain token’s price added nearly 3% to its value on April 19. 

More Cryptocurrencies News

Bitcoin Weekly Forecast: BTC post-halving rally could be partially priced in Premium

Bitcoin Weekly Forecast: BTC post-halving rally could be partially priced in

Bitcoin price briefly slipped below the $60,000 level for the last three days, attracting buyers in this area as the fourth BTC halving is due in a few hours. Is the halving priced in for Bitcoin? Or will the pioneer crypto note more gains in the coming days? 

More Bitcoin News

Bitcoin: BTC post-halving rally could be partially priced in Premium

Bitcoin: BTC post-halving rally could be partially priced in

Bitcoin (BTC) price briefly slipped below the $60,000 level for the last three days, attracting buyers in this area as the fourth BTC halving is due in a few hours. Is the halving priced in for Bitcoin? Or will the pioneer crypto note more gains in the coming days? 

Read full analysis

BTC

ETH

XRP