|

Link Technical Analysis: LINK/USD gearing up to crack $5 and establish a new 2020-high

  • LINK/USD is currently trading at $4.77, really close to the 2020-high established on April 3.
  • Link has formed two consecutive bullish reversal candlesticks on the daily chart.

LINK is changing hands at $4.76 at the time of writing after yet another bounce from $4.5. On June 24, LINK/USD dropped to $4.487 but recovered on the same day. Something similar happened on June 25 indicating that bulls have a lot of buying power and are willing to buy the dips.

LINK/USD daily chart

LINKUSD

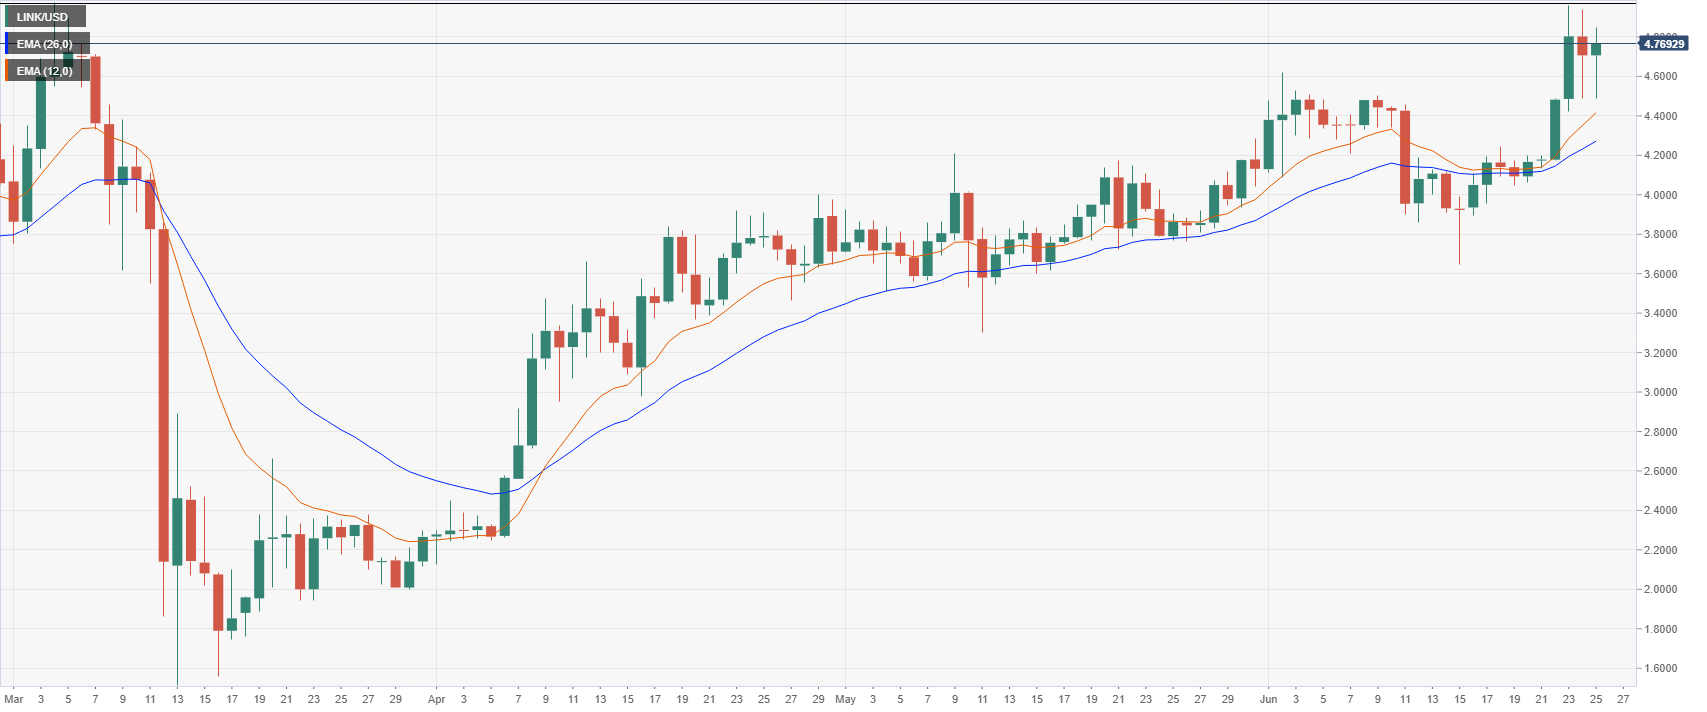
The daily chart is clearly in favor of the buyers and LINK continues trading way above the daily 12-EMA or the 26-EMA. After a brief pause around $4, LINK has continued with its long-term uptrend and it’s getting ready to crack $5 next. Bulls are only facing the $4.97, 2020-high, and $5 as resistance

LINK/USD 4-hour chart

LINKUSD

The 4-hour chart is still in an uptrend despite the last two volatile crashes. If LINK needs to consolidate further, bulls can use the 12-EMA at $4.68 for support. The most important level to hold is at $4.48 to keep the uptrend going.

Author

Lorenzo Stroe

Lorenzo Stroe

Independent Analyst

Lorenzo is an experienced Technical Analyst and Content Writer who has been working in the cryptocurrency industry since 2012. He also has a passion for trading.

More from Lorenzo Stroe
Share:

Editor's Picks

Ripple technical weakness persists as selling intensifies toward $1.00

Ripple grinds lower, trading around $1.10 at the time of writing on Wednesday. The sticky bearish outlook mirrors the broader crypto market, with major coins such as Bitcoin and Ethereum facing weak demand as investors de-risk.

Crypto Today: Bitcoin, Ethereum, XRP face downside pressure amid investor de-risking

Major crypto assets trade under intense headwinds on Wednesday, as market participants navigate complex geopolitical and macroeconomic environments. Bitcoin has slipped toward $61,000 after its recent rebound was sold near $64,000, leaving buyers exhausted.

Bitcoin Price Forecast: Sticky inflation fears threaten deeper sell-off in BTC

Bitcoin extends its decline on Wednesday, trading below $61,500 at the time of writing as renewed US-Iran tensions keep the risk sentiment capped. In addition, persistent capital outflows from US-listed spot Exchange Traded Funds continue to fuel selling pressure on BTC.

Pi Network extends decline as CEX outflows fail to offset bearish pressure

Pi Network edges lower on Wednesday, extending its third consecutive day of losses. The technical outlook for PI is largely bearish, with a risk of a steeper correction below $0.1184.

Bitcoin: After the bloodbath, everyone looks at $60,000
Bitcoin (BTC) hovers above $62,000 at the time of writing on Friday, weighed down by growing risk-off sentiment due to persistent geopolitical tensions in the Middle East and sticky macroeconomic uncertainty. The institutional sell-off continued to wreak havoc on capital flows, with spot Bitcoin Exchange-Traded Funds (ETFs) recording billions in outflows.