Bitcoin (BTC/USD) is breaking above key and critical resistance levels. The bullish impulse is starting to pick up pace.
Can the Bitcoin bulls challenge or break the previous top and ATH (all time high)?
Price Charts and Technical Analysis
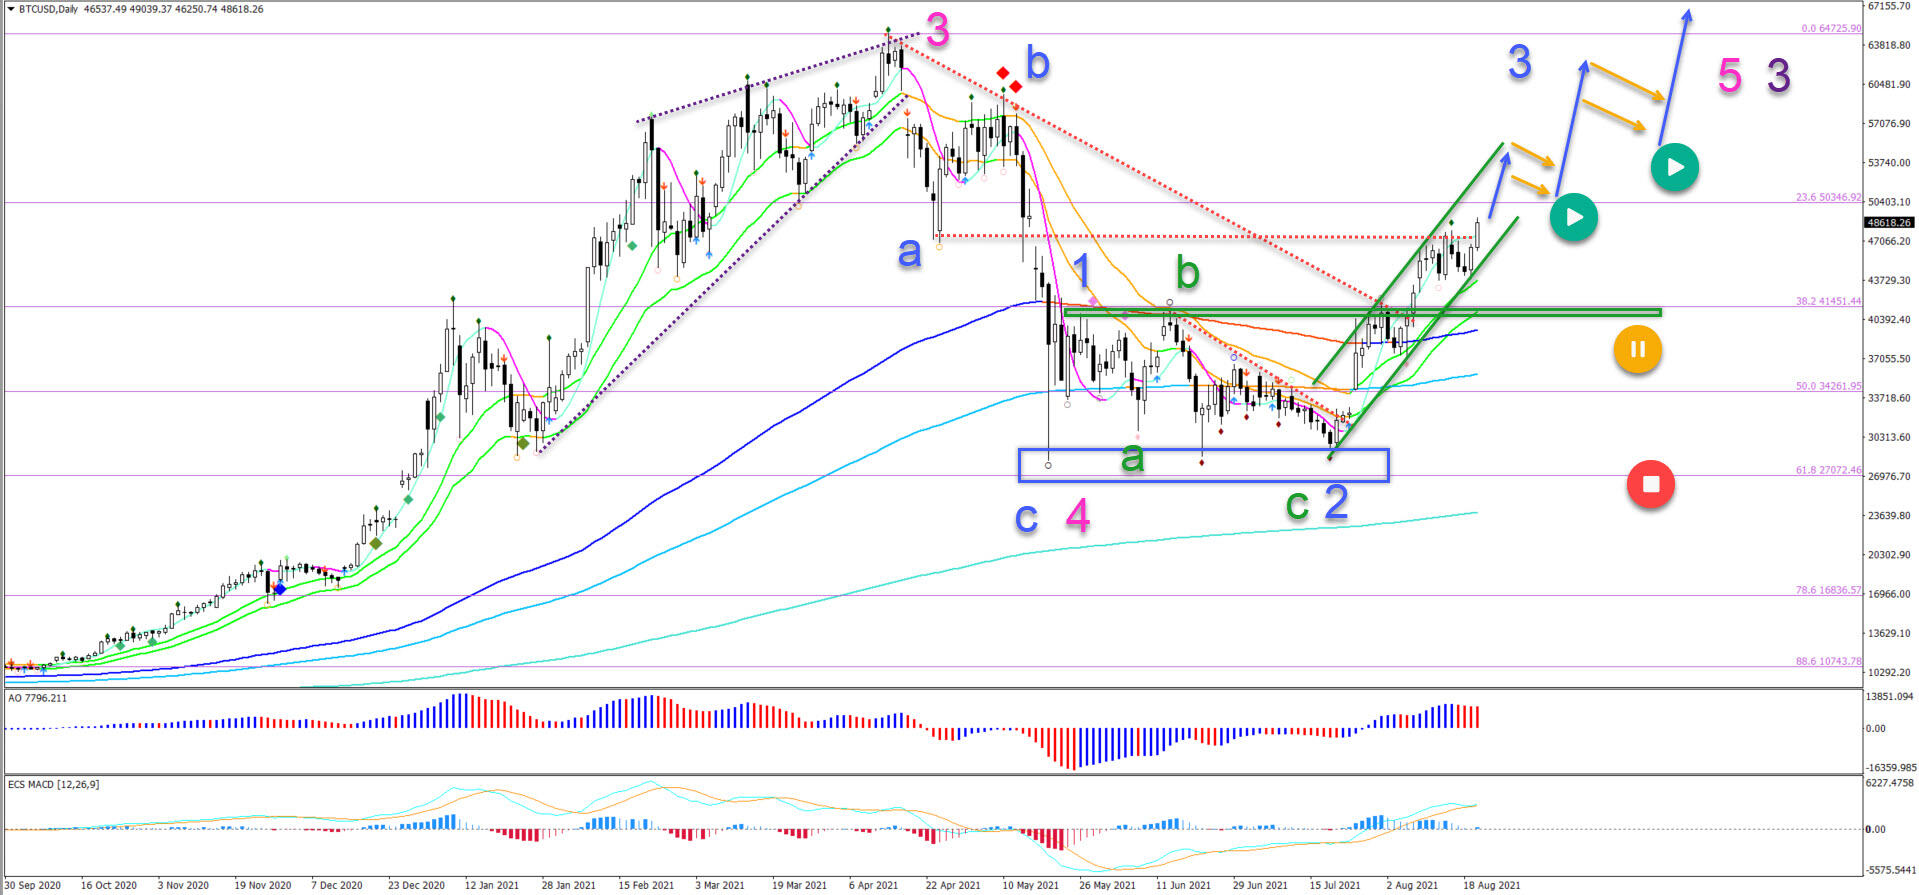
The BTC/USD daily chart was in a downtrend with lower lows and lower highs after price action completed a rising wedge reversal chart pattern (dotted purple lines):
- Price action, however, respected the 61.8% Fibonacci retracement support level.
- A bullish bounce confirms the wave 4 pattern (pink) after an ABC (blue).
- Price has managed to break above 3 different resistance zones (dotted red lines).
- Price is now moving higher in a bullish channel (green lines).
- The momentum is strong because price action has stayed above the 21 ema high for more than 2 weeks and the 21 ema high and low also have a steep angle.
- The momentum and wave patterns suggest more bullishness to test the previous top (blue arrows).
- Bull flag patterns (orange arrows) would help confirm the bullish outlook.
- The previous tops have now become a support zone (green box).
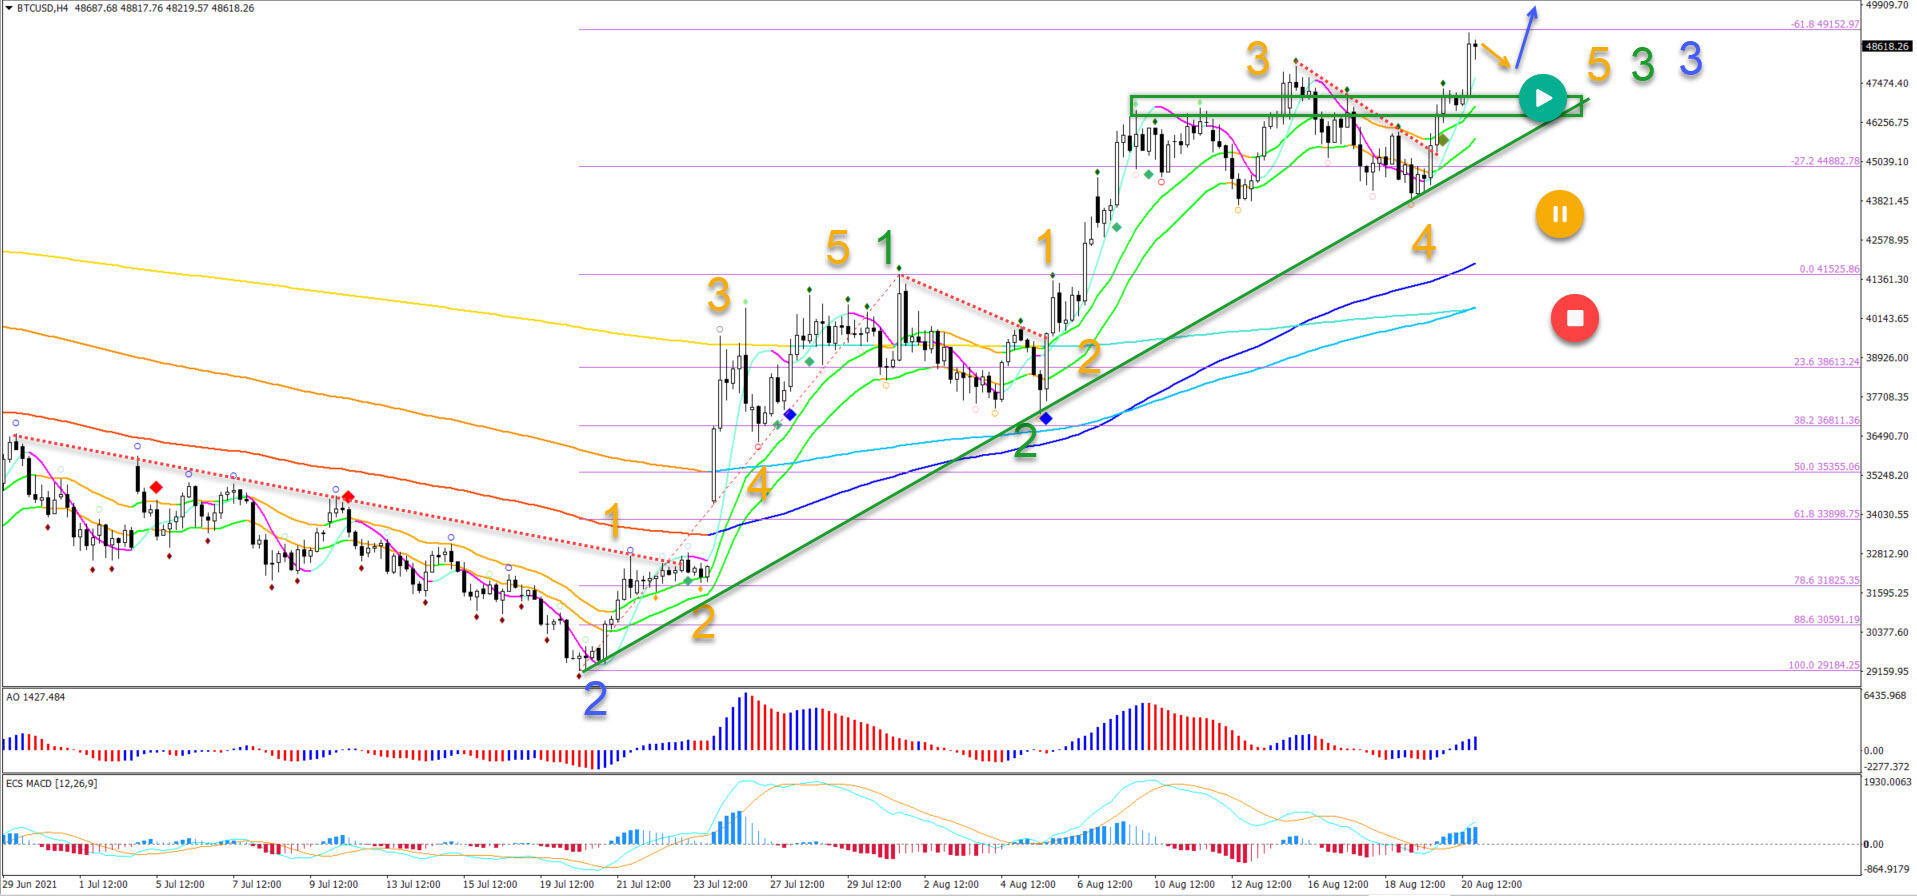
On the 4 hour chart, price action is showing strength to the upside and corrective movements to the downside. The bulls are fully in control:
- The bullish price swing is probably a wave 3 (green).
- A break above the -61.8% Fibonacci level would help confirm this outlook.
- A small retracement could take place but price action should respect the support zone (green).
- Any deeper retracement could place the current wave view on hold. In that case, a larger and deeper wave 1-2 pattern could take place.
- With a bullish continuation, price action should be in a wave 3 of wave 3.
The analysis has been done with the ecs.SWAT method and ebook.
Elite CurrenSea Training Program(s) should not be treated as a recommendation or a suggestion to buy or sell any security or the suitability of any investment strategy for Student. The purchase, sale, or advice regarding any security, other financial instrument or system can only be performed by a licensed Industry representative; such as, but not limited to a Broker/Dealer, Introducing Broker, FCM and/or Registered Investment Advisor. Neither Elite CurrenSea nor its representatives are licensed to make such advisements. Electronic active trading (trading) may put your capital at risk, hence all trading decisions are made at your own risk. Furthermore, trading may also involve a high volume & frequency of trading activity. Each trade generates a commission and the total daily commission on such a high volume of trading can be considerable. Trading accounts should be considered speculative in nature with the objective being to generate short-term profits. This activity may result in the loss of more than 100% of an investment, which is the sole responsibility of the client. Any trader should realise the operation of a margin account under various market conditions and review his or her investment objectives, financial resources and risk tolerances to determine whether margin trading is appropriate for them. The increased leverage which margin provides may heighten risk substantially, including the risk of loss in excess of 100% of an investment.
Recommended Content
Editors’ Picks
Ripple's move above this key level could trigger nearly 50% rally for XRP
Ripple has overcome a critical resistance level and flipped into a support floor on the weekly time frame. This development happened while XRP tightly consolidated for roughly 250 days. Investors can expect XRP to kickstart a massive rally.
Optimism price outlook with nearly $90 million worth of OP tokens flooding markets on Friday
Optimism volatility has shrunk in the ours leading to the network’s cliff unlock. It joins the likes of dYdX and Sui, which have similar events on their calendars. As token unlocks are often considered bearish catalysts, investors should brace for a reaction after the event.
Top 3 Price Prediction Bitcoin, Ethereum, Ripple: Retail watches from the sidelines with a bias for shorts
Bitcoin could clear $73,777 peak as BTC bulls resurface. Ethereum might fall 10% before next leg up as ETH RSI teases with sell signal. XRP could lose $0.6000 threshold as Ripple bulls fail to show up.
Jito price could hit $6 as JTO coils up inside this bullish pattern
Jito price action shows a potential cup and handle formation. Based on theoretical measurement rules, a successful breakout could yield a 56% rally to $6.0. A breakdown of the $3.86 support level would create a lower low for JTO and invalidate the bullish thesis.
Bitcoin: BTC may have recovered, but is it out of the woods?
Bitcoin’s (BTC) upward momentum has shown a significant decline for the past two weeks or so. This development led to a bearish signal on the weekly and an uncertain outlook on the monthly.