Kyber Network Technical Analysis: KNC/USD eying up $2 again after a brief and healthy consolidation
- KNC/USD is up 7% in the last 24 hours after a healthy pullback to $1.55.
- The daily RSI has cooled off slightly but it’s still on the verge of overextension.

Kyber Network has been outperforming basically the entire crypto market for the past month. On July 3, KNC/USD hit a new 2020-high at $2.05, a level not seen since May 2018. After two days of healthy consolidation, KNC bulls are back and eying up $2 again.
KNC/USD daily chart
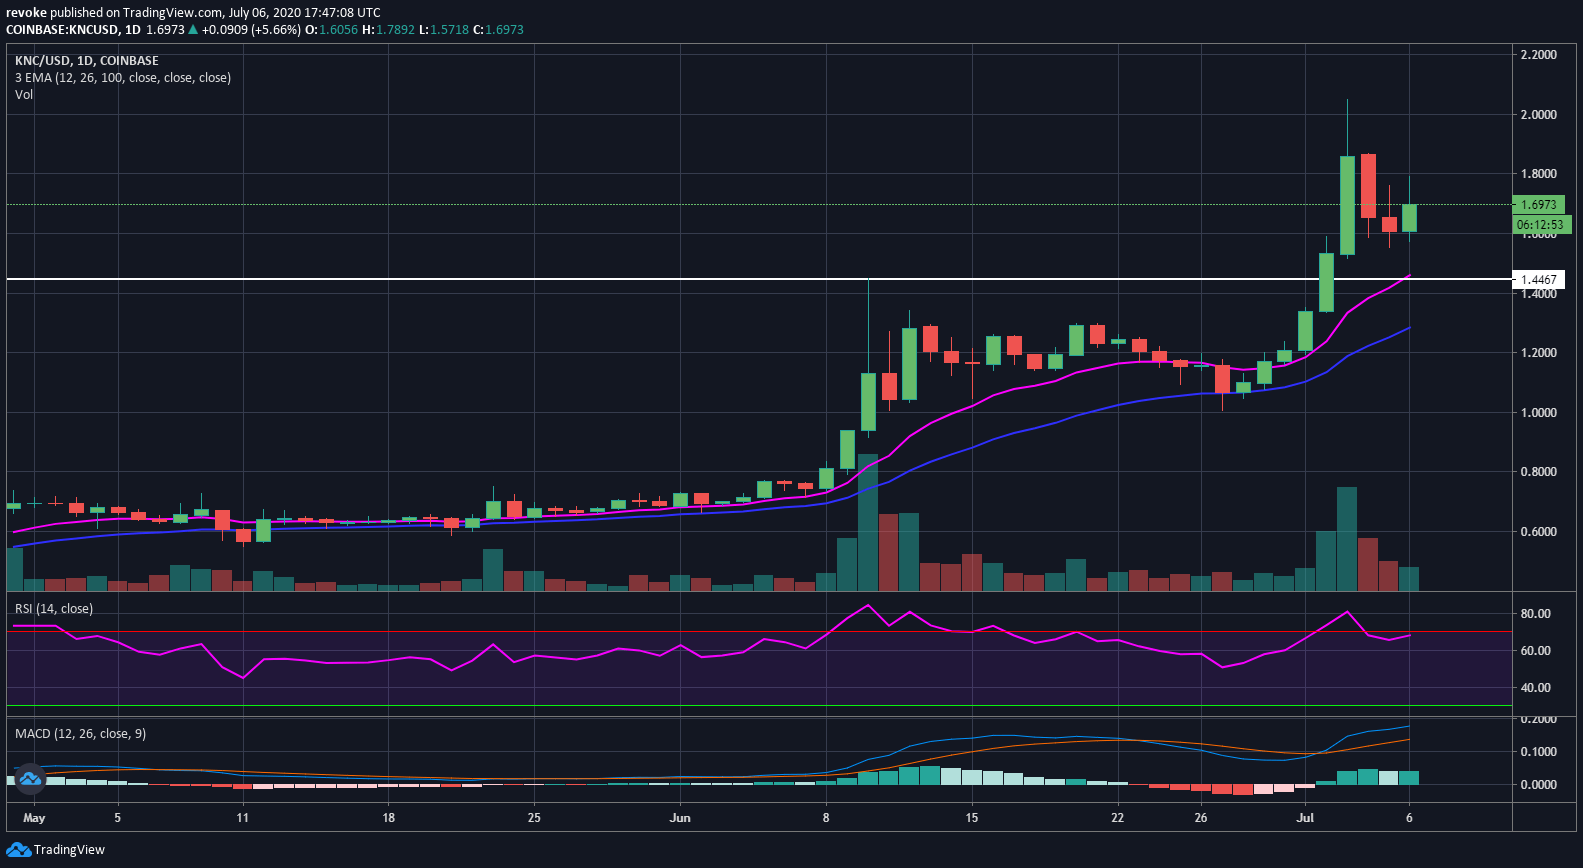
Buyers can still use the 12-EMA and the 26-EMA for support if they can’t crack $2 again. The low at $1.55 will also serve as a support level. As for resistance, bulls are only facing the one at $2 and $2.05.
KNC/USD 4-hour chart
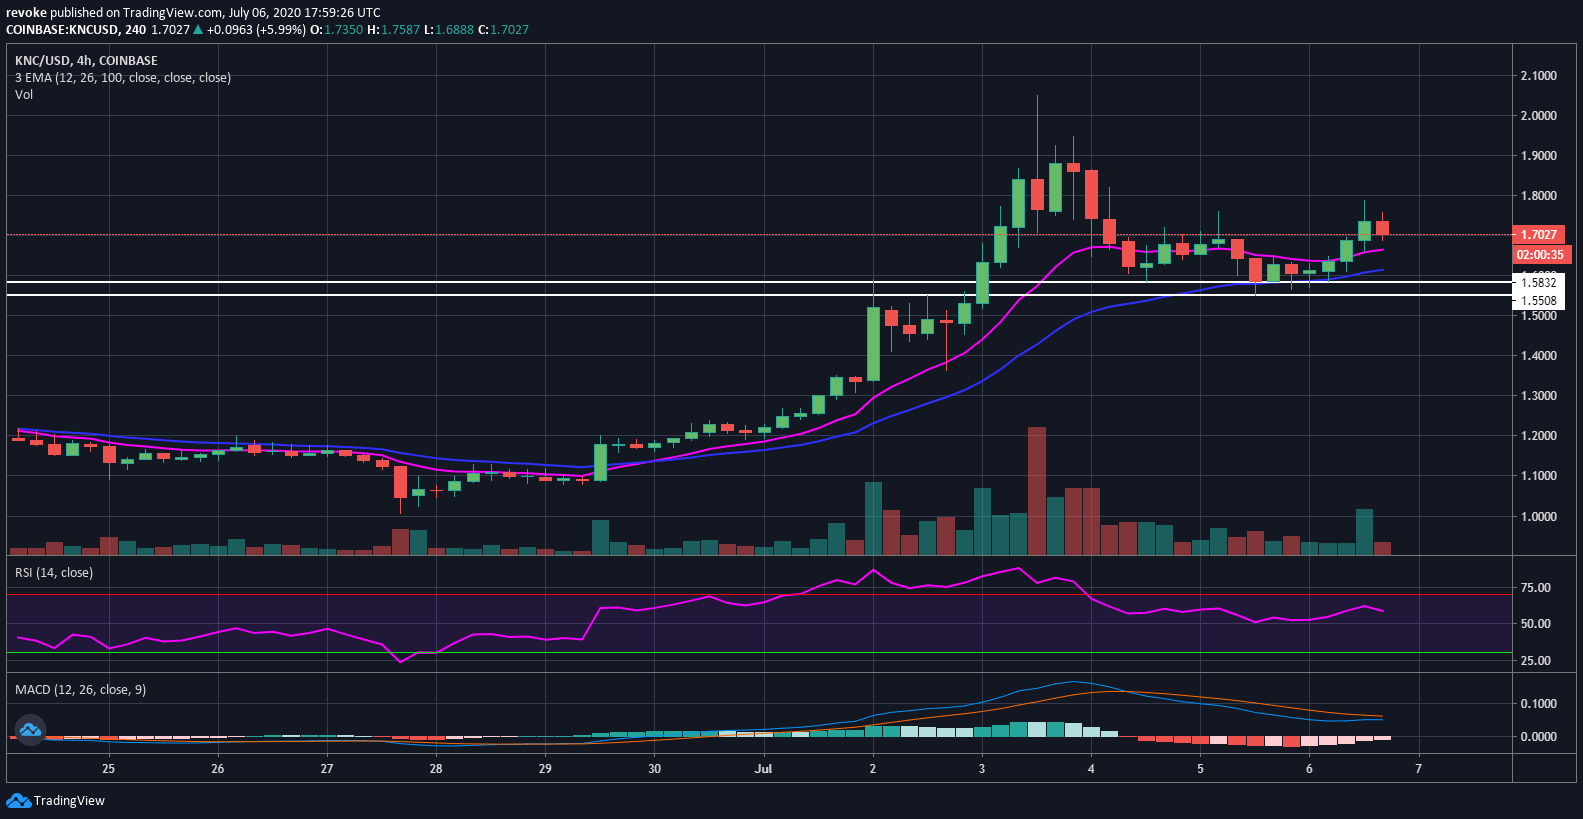
The 4-hour chart is currently not in an uptrend because bulls couldn’t hold $1.58 and set a new lower low at $1.55. Nonetheless, the momentum is quite strong and the MACD is on the verge of a bull cross.
Author

Lorenzo Stroe
Independent Analyst
Lorenzo is an experienced Technical Analyst and Content Writer who has been working in the cryptocurrency industry since 2012. He also has a passion for trading.


