Kyber Network Price Prediction: KNC faces strong selling pressure despite new protocol launch
- The Kyber Network has just launched its new Dynamic Market Maker Protocol live on Mainnet.
- The digital asset faces a lot of selling pressure as key indicator has presented two sell signals on the 12-hour and daily charts.
- On-chain metrics show KNC can invalidate both signals as there is weak resistance ahead.

The Kyber Network has launched a new market maker protocol called the Kyber DMM which provides users with greater flexibility, liquidity, and high capital efficiency. This is only the beta release of the product but it’s available to everyone.
Kyber launches a new protocol ahead of Kyber 3.0 upgrade
The mainnet beta release of the Kyber Dynamic Market Maker Protocol will allow users to spend less on fees, and liquidity providers to benefit from an innovative programmable pricing curve. Loi Luu, Co-Founder of Kyber Network stated:
Kyber DMM protocol allows anyone to be a liquidity provider with the advantages of dynamic fees and very high capital efficiency, and we believe this will empower a whole new generation of liquidity providers, takers, and developers to effectively engage in the world of decentralized Finance.
The codebase of Kyber DMM’s has already been reviewed and audited by the team and external auditors. It is open source and everyone can check it as well.
Can Kyber Network price invalidate the sell signals?
On the 12-hour and daily charts, the TD Sequential indicator has just presented two sell signals which add a lot of selling pressure to KNC. To invalidate both signals, the digital asset must climb above the previous high of $3.8.
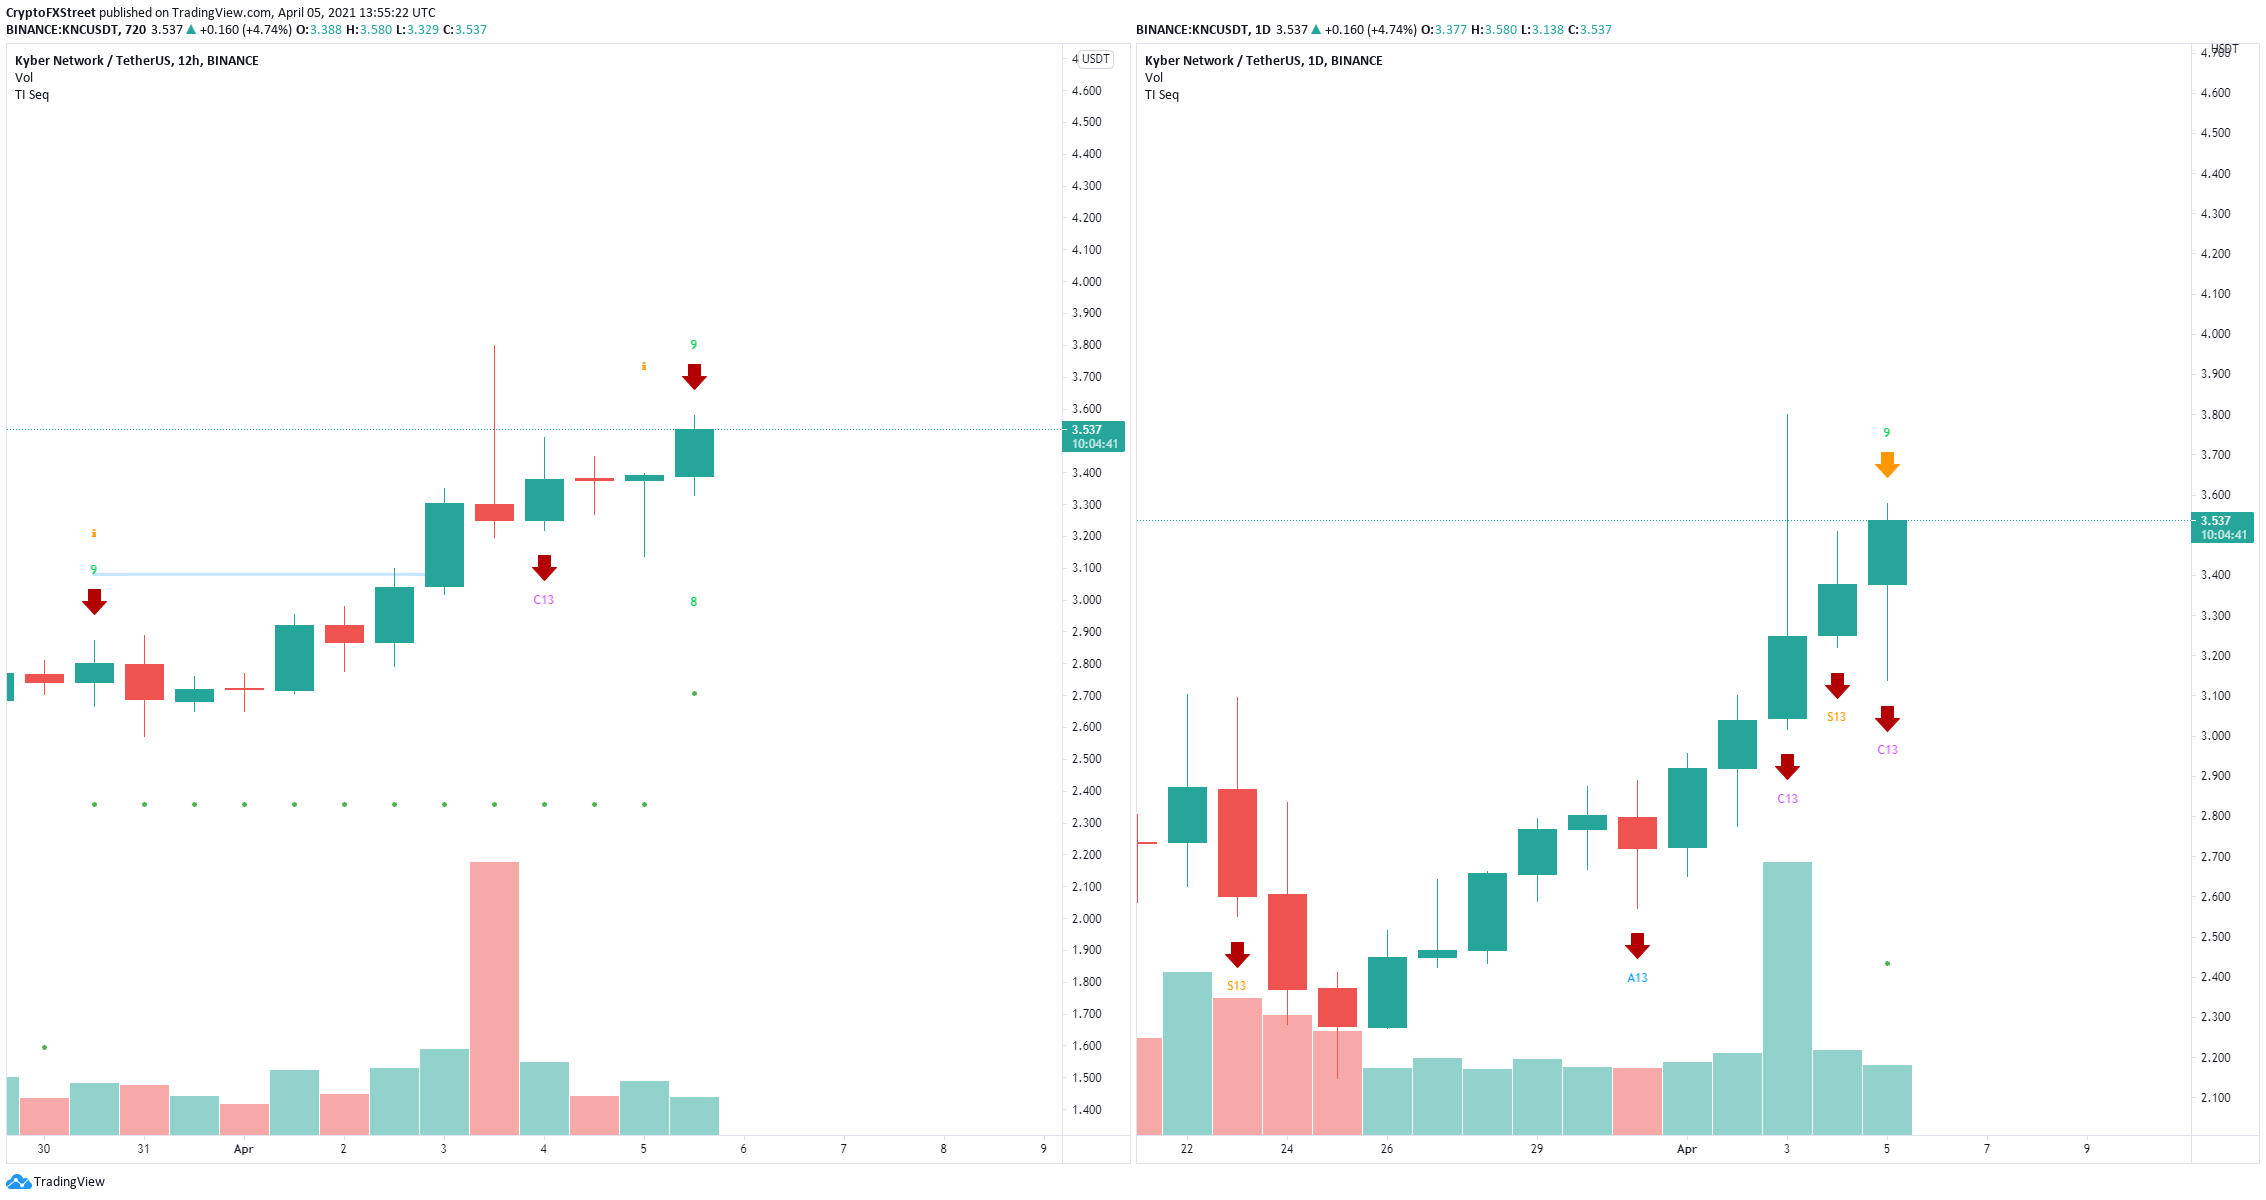
KNC/USD sell signals
The In/Out of the Money Around Price (IOMAP) chart shows a lot of support between $3.44 and $3.23. A breakdown below this area will quickly drive KNC towards $3 as the next support point.
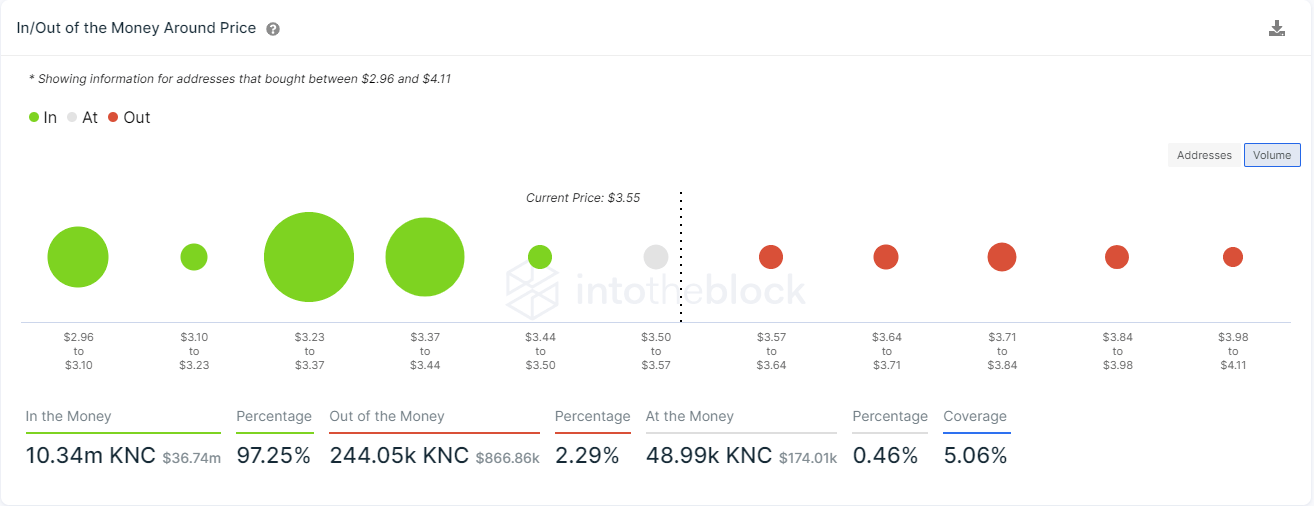
KNC IOMAP chart
A breakout above $3.8 would invalidate the sell signals and can drive KNC towards $4.11 as there is weak resistance ahead according to the IOMAP model.
Author

Lorenzo Stroe
Independent Analyst
Lorenzo is an experienced Technical Analyst and Content Writer who has been working in the cryptocurrency industry since 2012. He also has a passion for trading.


