KARRAT coin is a governance token supporting the KARRAT Protocol, a decentralized gaming infrastructure layer. In this article, we’ll plain the current bullish Elliott Wave structure taking place within the daily cycle.
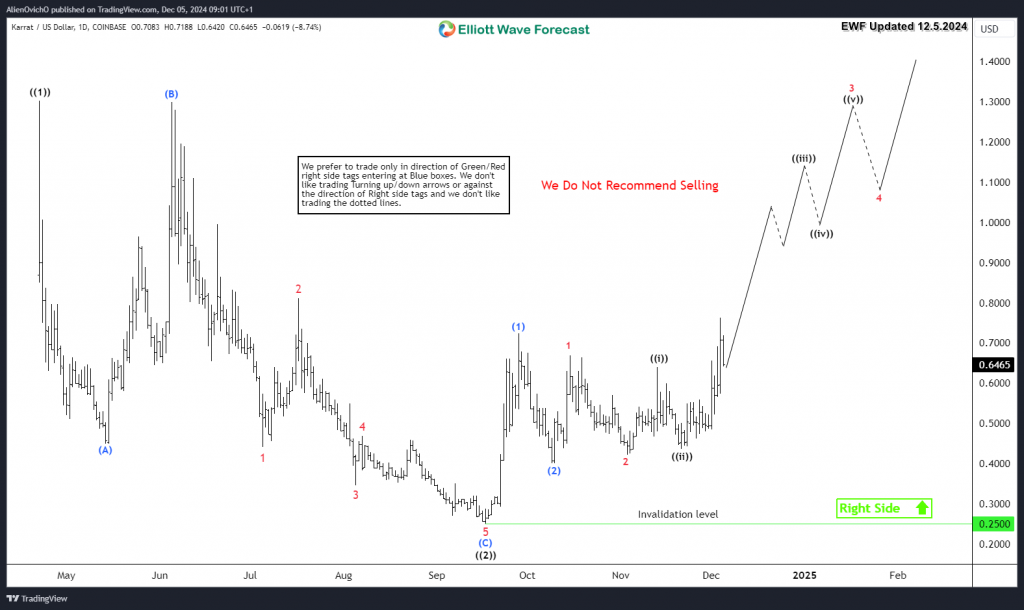
Since April 2024, KARRAT did a corrective 3 waves ZigZag structure in wave ((2)). The decline took the coin lower toward $0.25 where it ended the move on September 2024. Up from there, it started the new cycle to the upside in wave ((3)). The current initial move is showing a bullish sequence from the lows within a nesting structure. The coins spent 3 months within a sideways range building the nest structure and it’s currently starting the breakout higher in wave ((iii)) of 3 which is considered the strongest wave within the cycle.
Consequently, Karrat will remain supported above the recent November low $0.43. Investors and buyers will be looking to keep buying the pullbacks in 3 , 7 or 11 swings. The daily target after it breaks into new all time highs comes at $1.9.
KARRAT daily chart 12.5.2024
FURTHER DISCLOSURES AND DISCLAIMER CONCERNING RISK, RESPONSIBILITY AND LIABILITY Trading in the Foreign Exchange market is a challenging opportunity where above average returns are available for educated and experienced investors who are willing to take above average risk. However, before deciding to participate in Foreign Exchange (FX) trading, you should carefully consider your investment objectives, level of xperience and risk appetite. Do not invest or trade capital you cannot afford to lose. EME PROCESSING AND CONSULTING, LLC, THEIR REPRESENTATIVES, AND ANYONE WORKING FOR OR WITHIN WWW.ELLIOTTWAVE- FORECAST.COM is not responsible for any loss from any form of distributed advice, signal, analysis, or content. Again, we fully DISCLOSE to the Subscriber base that the Service as a whole, the individual Parties, Representatives, or owners shall not be liable to any and all Subscribers for any losses or damages as a result of any action taken by the Subscriber from any trade idea or signal posted on the website(s) distributed through any form of social-media, email, the website, and/or any other electronic, written, verbal, or future form of communication . All analysis, trading signals, trading recommendations, all charts, communicated interpretations of the wave counts, and all content from any media form produced by www.Elliottwave-forecast.com and/or the Representatives are solely the opinions and best efforts of the respective author(s). In general Forex instruments are highly leveraged, and traders can lose some or all of their initial margin funds. All content provided by www.Elliottwave-forecast.com is expressed in good faith and is intended to help Subscribers succeed in the marketplace, but it is never guaranteed. There is no “holy grail” to trading or forecasting the market and we are wrong sometimes like everyone else. Please understand and accept the risk involved when making any trading and/or investment decision. UNDERSTAND that all the content we provide is protected through copyright of EME PROCESSING AND CONSULTING, LLC. It is illegal to disseminate in any form of communication any part or all of our proprietary information without specific authorization. UNDERSTAND that you also agree to not allow persons that are not PAID SUBSCRIBERS to view any of the content not released publicly. IF YOU ARE FOUND TO BE IN VIOLATION OF THESE RESTRICTIONS you or your firm (as the Subscriber) will be charged fully with no discount for one year subscription to our Premium Plus Plan at $1,799.88 for EACH person or firm who received any of our content illegally through the respected intermediary’s (Subscriber in violation of terms) channel(s) of communication.
Recommended Content
Editors’ Picks
Shiba Inu could recover as it finds support around key level
Shiba Inu (SHIB) price hovers around $0.000021 on Tuesday after retesting and bouncing off from key support the previous day. Sideline investors looking to accumulate SHIB can do so at support levels from $0.000019 to $0.000021.
Bitcoin recovers after retesting $90K support
Bitcoin’s price recovers and trades at around $95,500 on Tuesday after dipping below $90,000 the previous day. The recent downturn at the start of the week has liquidated over $734 million in total liquidations, more than $152 million specifically in BTC.
Monero bulls remain strong, eyes double-digit gains
Monero price trades in the green, around $204.92 on Tuesday after holding its ascending trendline support the previous day. The technical outlook suggests a reversal ahead as XMR’s MACD indicator shows a bullish signal.
XRP sees high buying pressure as lawyer weighs in on SEC's appeal against Ripple
XRP's strong resilience against the wider crypto market decline was strengthened by increased buying activity across retail and institutional investors. SEC's delay in filing opening brief in appeal over Ripple vs SEC ruling is a normal occurrence in litigation processes.
Bitcoin: Room for a recovery or continuation of the pullback?
Bitcoin’s price slightly recovers and trades around $94,700 on Friday after declining nearly 6% earlier this week. US Bitcoin spot Exchange Traded Funds data shows signs of mild recovery, with a total net inflow of $462.2 million until Thursday.
Best Forex Brokers with Low Spreads
VERIFIED Low spreads are crucial for reducing trading costs. Explore top Forex brokers offering competitive spreads and high leverage. Compare options for EUR/USD, GBP/USD, USD/JPY, and Gold.