JasmyCoin Price Forecast: JASMY rebounds as whales accumulate, rises
- JasmyCoin price recovers, trading above $0.016 on Tuesday after a mild decline the previous day.
- On-chain data shows certain whale wallets accumulating JASMY tokens.
- The derivatives market shows bullish bets among traders, hitting their highest level in a month.

JasmyCoin (JASMY) price recovers trading above $0.016 at the time of writing on Tuesday after a mild fall the previous day. On-chain and derivatives data support the bullish thesis, as certain whale wallets are accumulating JASMY tokens, and bullish bets reach the highest monthly level among traders, suggesting a rally on the horizon.
JasmyCoin’s on-chain and derivatives data hints at a rally
Santiment’s Supply Distribution shows that a certain whale wallet holding JASMY tokens between 1 million and 10 million (yellow line in the chart below) had accumulated 40 million JASMY tokens from Sunday to Tuesday, increasing the exposure and indicating investors’ confidence, which could cause a rise in JasmyCoin prices as buying pressure mounts.
 [08-1754969774400-1754969774413.11.28, 12 Aug, 2025].png)
JasmyCoin Supply Distribution chart. Source: Santiment
CryptoQuant Exchange Netflow data shows that 54.49 million Jasmy tokens were withdrawn from exchanges on Monday. The increase in outflows from exchanges is generally a bullish sign as it indicates reduced selling pressure.
 - All Exchanges-1754969801730-1754969801733.png)
JasmyCoin Exchange Netflow (Total) chart. Source: CryptoQuant
Another bullish outlook is the rising bullish bets among traders. CoinGlass data shows that JASMY’s long-to-short ratio reads 1.07, the highest level over a month.
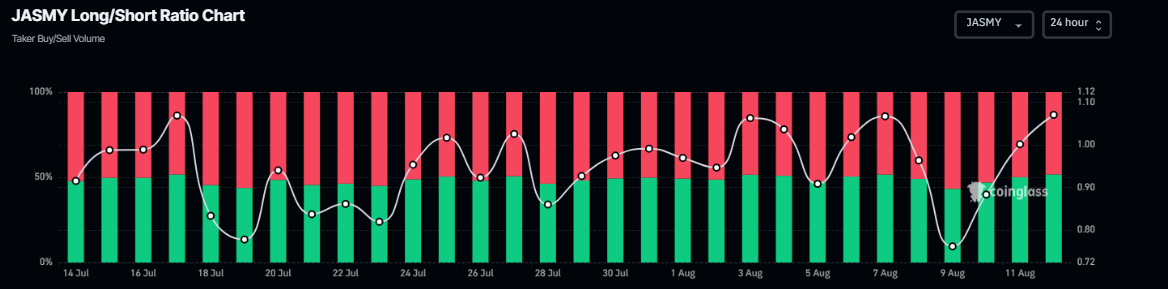
JASMY long-to-short ratio chart. Source: CoinGlass
JasmyCoin Price Forecast: JASMY momentum indicators show bullish bias
JasmyCoin price found support around the ascending trendline (drawn by connecting multiple lows since mid-June) in early August and rose by 10.29% last week. At the time of writing on Tuesday, it recovers slightly, trading above $0.016.
If JASMY rallies and closes above the weekly resistance at $0.0175, it could extend the rally toward its July 21 high of $0.028.
The Relative Strength Index (RSI) on the daily chart reads 55 points upwards, above its neutral value of 50, indicating bullish momentum is gaining traction. In addition to this optimism, the Moving Average Convergence Divergence (MACD) also showed a bullish crossover on Sunday, giving a buy signal and indicating the start of an upward trend.
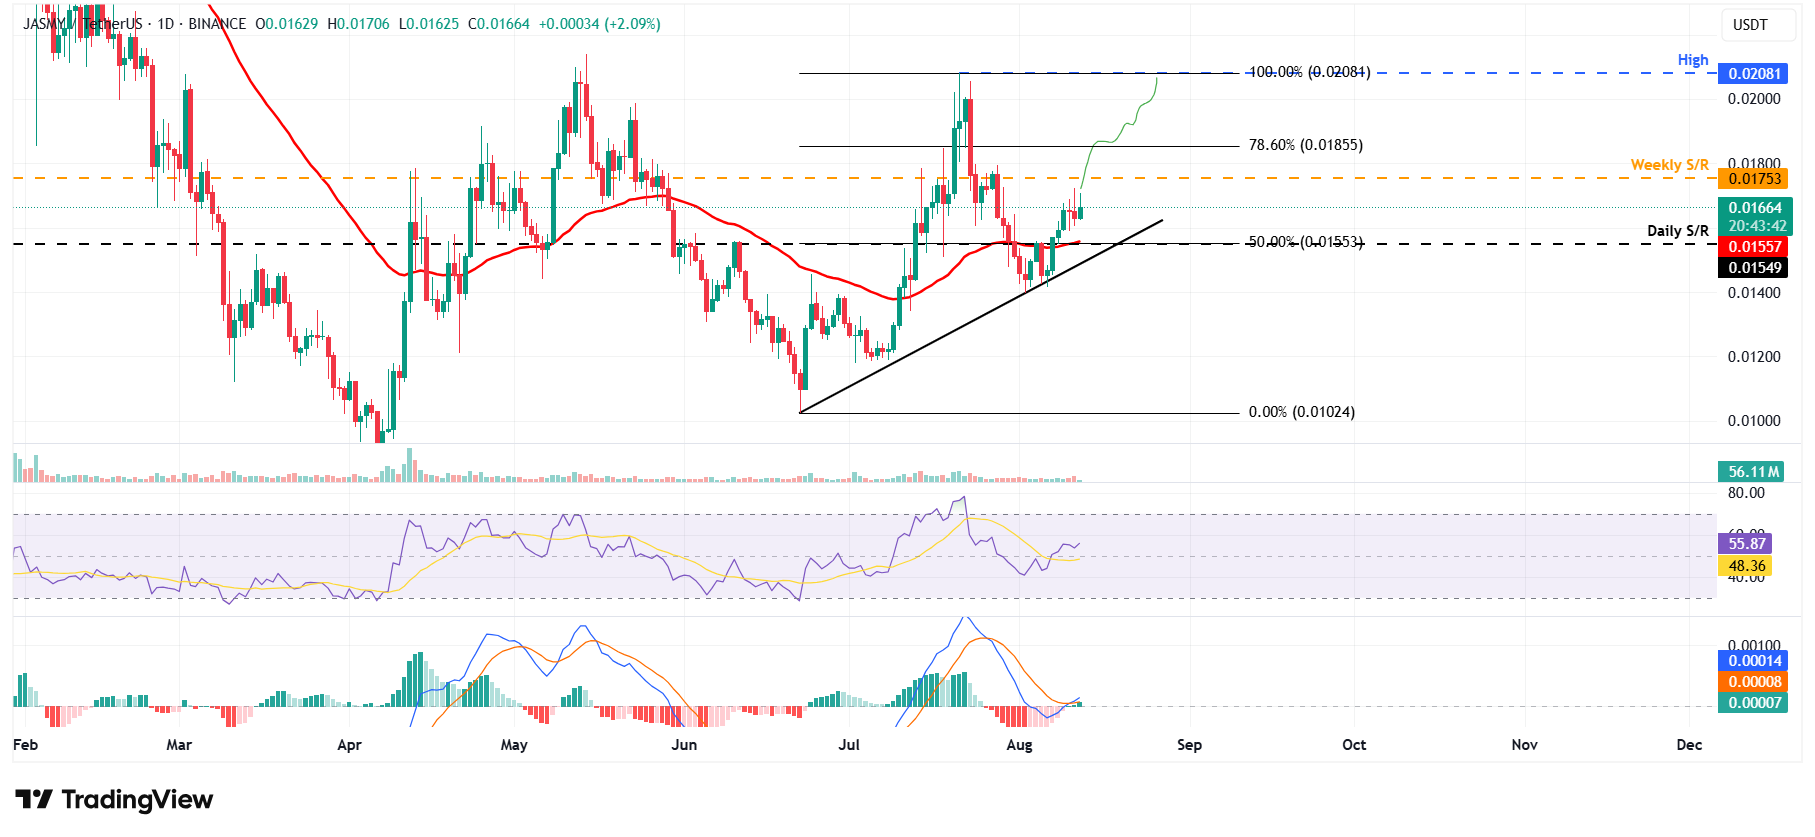
JASMY/USDT daily chart
However, if JASMY faces a correction, it could extend the decline to find support around its daily support at $0.015.
Author

Manish Chhetri
FXStreet
Manish Chhetri is a crypto specialist with over four years of experience in the cryptocurrency industry.



