Is this the end of the road for Avalanche price?
- Avalanche price slips below an ascending channel, breaking a two-month uptrend.
- Bulls must arrest the bearish correction immediately or risk losses to $25.00 and $21.00.
- Investors believe Avalanche price is in a buy zone but lacks a catalyst to sustain an ascending parallel channel.

Avalanche price grinds to a halt, breaking a two-month trend within an ascending parallel channel. Despite breaking above $30.00, AVAX failed to close the gap to $40.00. Initially, higher support at $28.00 mitigated the bears’ influence on the price. However, Avalanche price retreated to exchange hands at $26.22 amid growing risks of a further decline to $25.00 and $21.00, respectively.
Avalanche price shifts gears as declines linger
Odds start to flip against Avalanche price after it brushes shoulders with resistance at $30.00. Bulls fearlessly battle to keep the trend north but are likely to have been overwhelmed by investors’ profit-taking activities. Besides, the Parabolic SAR moves above the price, thus tipping the scales further on the bearish side.
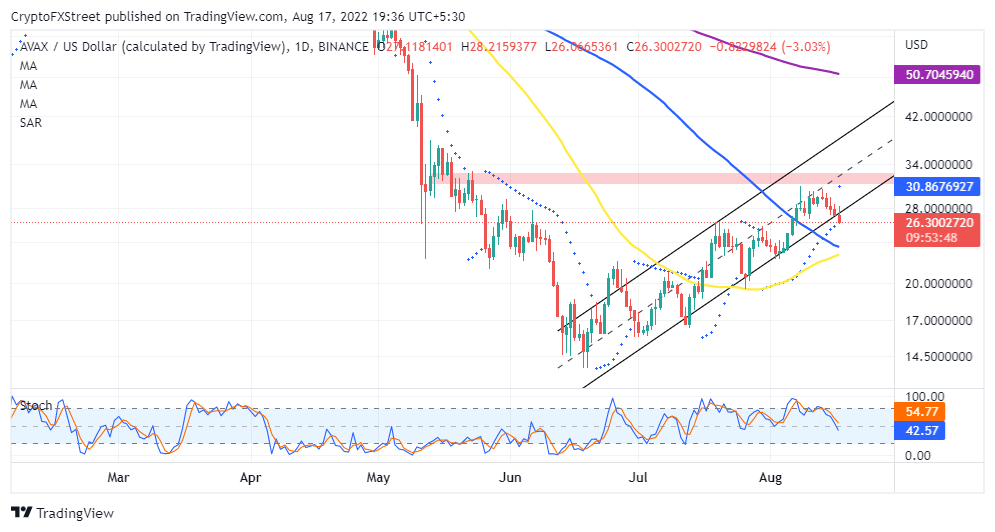
AVAX/USD daily chart
With support at $28.00 already broken, the focus is on subsequent anchors at $25.00 and $21.00. Reinforcing the higher level is the 100-day Simple Moving Average (SMA). Trading below this area, and by extension, the 50-day SMA could push Avalanche price to explore the buyer congestion at $21.00.
The Stochastic oscillator on the same daily chart adds credence to the pessimistic outlook as it sharply descends beneath the midline. Avalanche price’s ongoing pullback is unlikely to be aborted owing to a bearish divergence formed by the Stochastic oscillator.
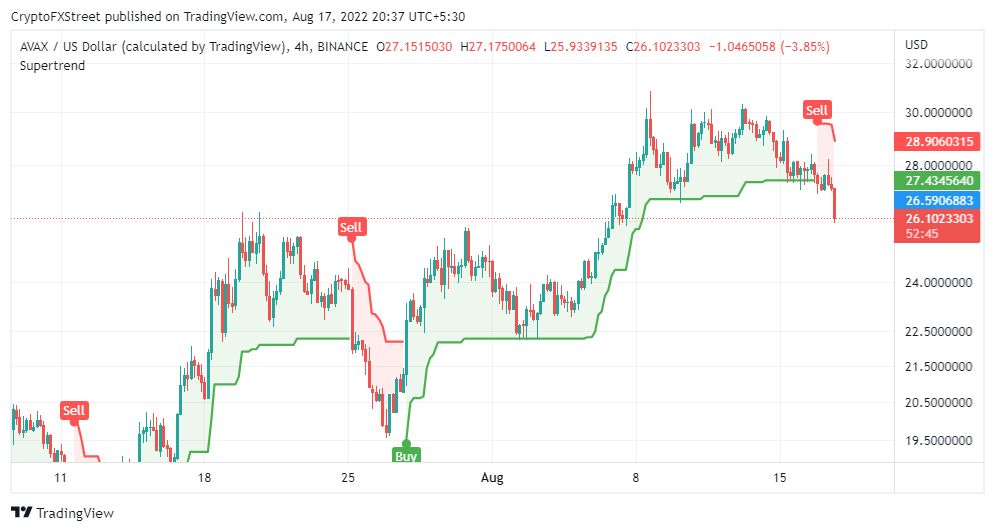
AVAX/USD four-hour chart
A sell signal presented by the Super Trend indicator on the four-hour chart could thin the chances of an Avalanche price recovery in the short term. This index overlays the chart like a moving average but incorporates the Average True Range (ATR) to gauge the volatility. AVAX will keep exploring downhill levels if the Super Trend indicator stays above the price.
 [17.07.46, 17 Aug, 2022]-637963482402541754.png)
Avalanche Weighted Average
Although technical factors appear to be working against Avalanche price, investors believe this is the time to get on board. Santiment’s Weighted Sentiment holds at -0.3270, down from 0.0507 last week.
As elucidated in the chart, readings above the mean line suggest AVAX is becoming overvalued, hence the tendency to pull back as investors book profits. On the contrary, movement below the same line indicates undervaluation, which generally implies time to buy.
Author

John Isige
FXStreet
John Isige is a seasoned cryptocurrency journalist and markets analyst committed to delivering high-quality, actionable insights tailored to traders, investors, and crypto enthusiasts. He enjoys deep dives into emerging Web3 tren


