IOTA Price Analysis: Shooting star bodes ill for IOT/USD
- IOTA experienced a sharp collapse, the coin is moving in sync with the market.
- A shooting star on a daily chart implies more downside pressure on the price.

IOTA, now the 23d largest digital asset with the current market value of $896 million, topped at $0.3526 on February 12 and hit the low of $0.3110 on Thursday, February 13. The coin's collapse has been caused by a sudden increase in the cryptocurrency market volatility, while no fundamental reasons are readily available at this stage.
IOT/USD: Technical picture
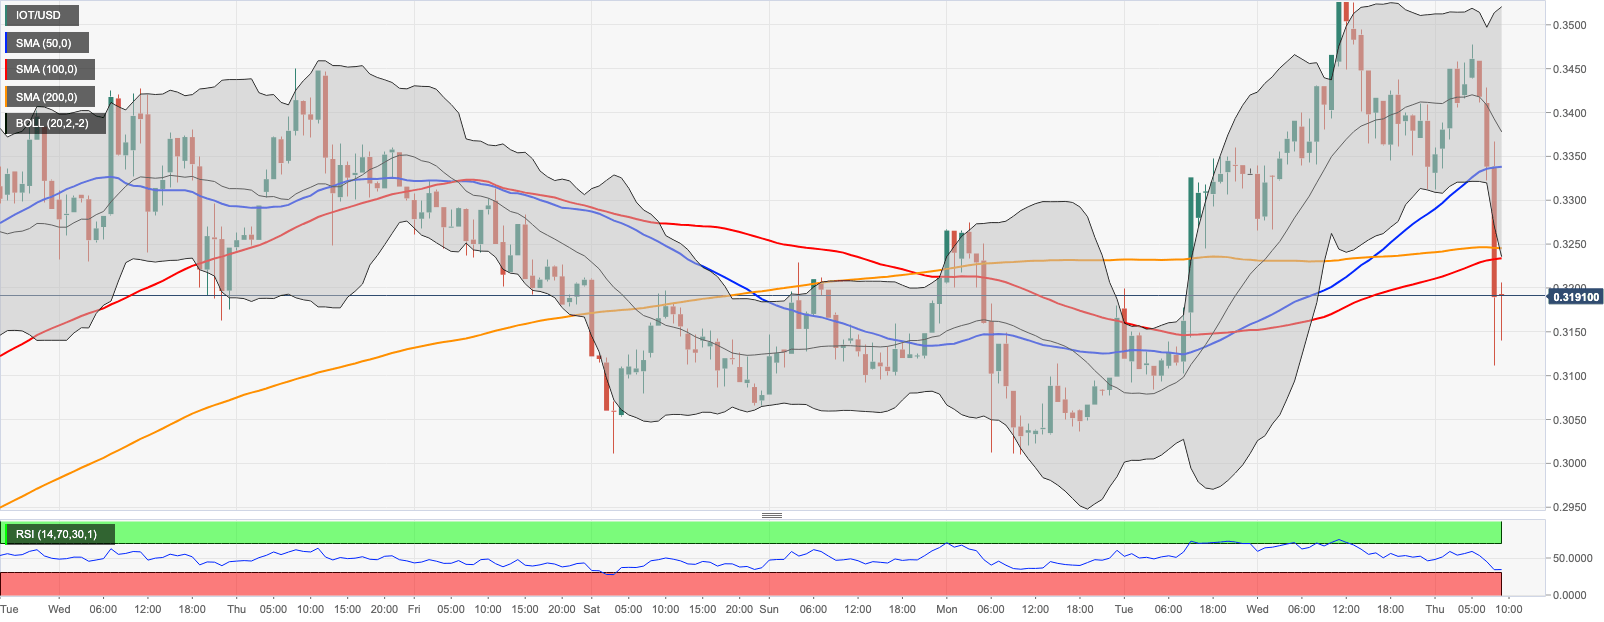
On the intraday charts, IOT/USD is changing hands below the critical support area created by a combination of SMA100 and SMA200 1-hour. Now the price is moving quickly towards $0.3100. Once it is out of the way, $0.3000 will come into focus. This area stopped the decline on February 10, while a layer of buy orders located on approach helped to engineer a rebound. Most likely, this time $0.3000 will also serve as strong support and slow down the sell-off.
On the upside, IOTA's price needs to return above $0.3230 to mitigate the immediate bearish pressure. The next resistance is located at $0.3340. This barrier is reinforced by SMA50 1-hour. Psychological $0.3400 might slow down the recovery and push the price inside the range.
IOT/USD 1-hour chart
On a daily chart, the price created a shooting star which is considered as a bearish signal. The pattern is confirmed by today's long bearish candle. It implies that the coin may be vulnerable to further losses with the long-term bearish target at $0.2460. This strong support is created by a confluence of several technical indicators, including SMA50 and SMA200 on a daily chart, and the lower line of the daily Bollinger Band.
IOT/USD daily chart
-637171831085163865.png)
Author

Tanya Abrosimova
Independent Analyst


