IOST Technical Analysis: IOST/USD 13% surge means the digital asset is up more than 400% since March 13
- IOST/USD is up 13% after hitting $0.0068 on Binance.
- The digital asset is up by more than 400% since March 13.
- The daily 12-EMA has been a perfect support line.

IOST is up another 13% on June 22 from a low of $0.0059. The digital asset is in a robust daily uptrend and is seeing increasing trading volume. After establishing the low of 2020 at $0.0013 on March 13, IOST has been trading inside an uptrend and has seen a significant surge in trading volume since May 21.
IOST/USDT daily chart
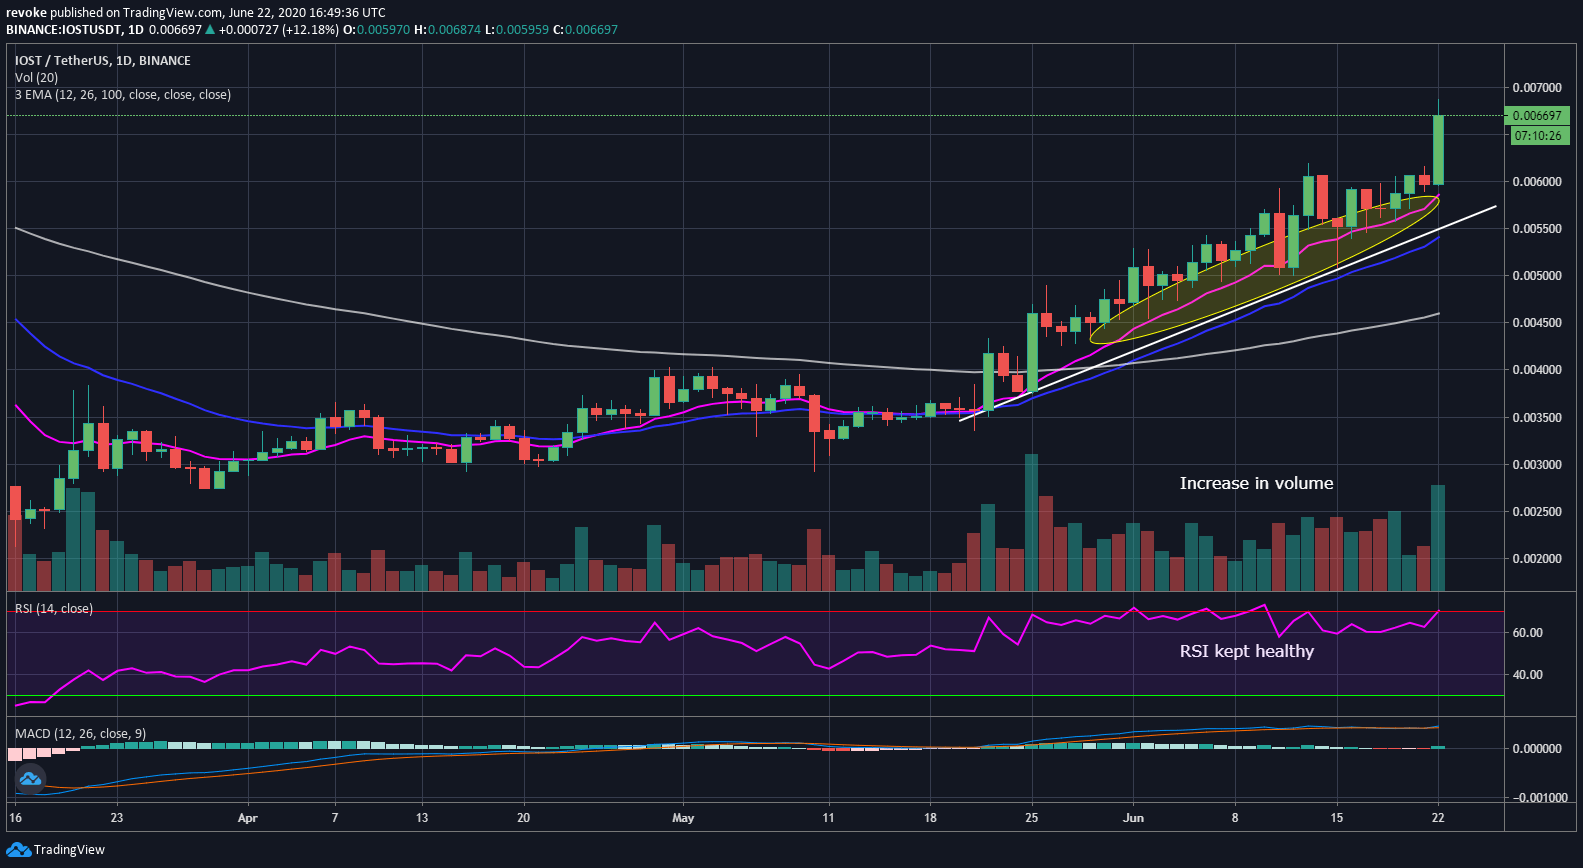
The daily chart of IOST is remarkably strong and healthy. Every bull move was accompanied by periods of consolidation cooling off the RSI which hasn’t been over 74 points in the last two months. The daily 12-EMA, currently established at $0.0058 has served as a support guide for the bulls. The EMA was only broken twice and both times, buyers came back even stronger.
The increase in trading volume across all exchanges is also quite obvious in the past month which indicates the current uptrend and bull run is real and stable.
Author

Lorenzo Stroe
Independent Analyst
Lorenzo is an experienced Technical Analyst and Content Writer who has been working in the cryptocurrency industry since 2012. He also has a passion for trading.


