Hyperliquid Price Forecast: HYPE rally cools as DeFi TVL, stablecoins hit record highs
- Hyperliquid retraces from its $58.78 record high, indicating profit-taking and an overheated market.
- Hyperliquid DeFi TVL surges to record $2.72 billion amid steady investor confidence.
- Stablecoins market capitalization on Hyperliquid approaches the $6 billion mark as platform adoption grows.

Hyperliquid (HYPE) edges lower, down around 2.5% to trade slightly below $54.00 on Thursday. The token powering the Layer-1 protocol for a fully-optimized financial system on-chain, has recently rallied, reaching an all-time high of $58.78.
HYPE’s ongoing correction can be attributed to profit-taking and extremely overheated market conditions, considering a 25% growth in value from September 1.
Hyperliquid DeFi TVL and stablecoins market cap surge
Hyperliquid’s staking mechanism has experienced significant growth over the past few months, increasing from approximately $330 million on April 1 to $2.72 billion as of Thursday. Total Value Locked (TVL) in Decentralized Finance (DeFi) refers to the cumulative value of all coins held in smart contracts of all the protocols on the chain.
A steady increase in TVL indicates investor confidence in the Hyperliquid ecosystem. Hence, their willingness to lock HYPE holdings into smart contracts on the chain, earning staking rewards in return.
A higher TVL also reduces the circulating supply and subsequently the potential selling pressure. A decrease in HYPE tokens on the open market, while demand increases, is a recipe for a sustainable price rally.
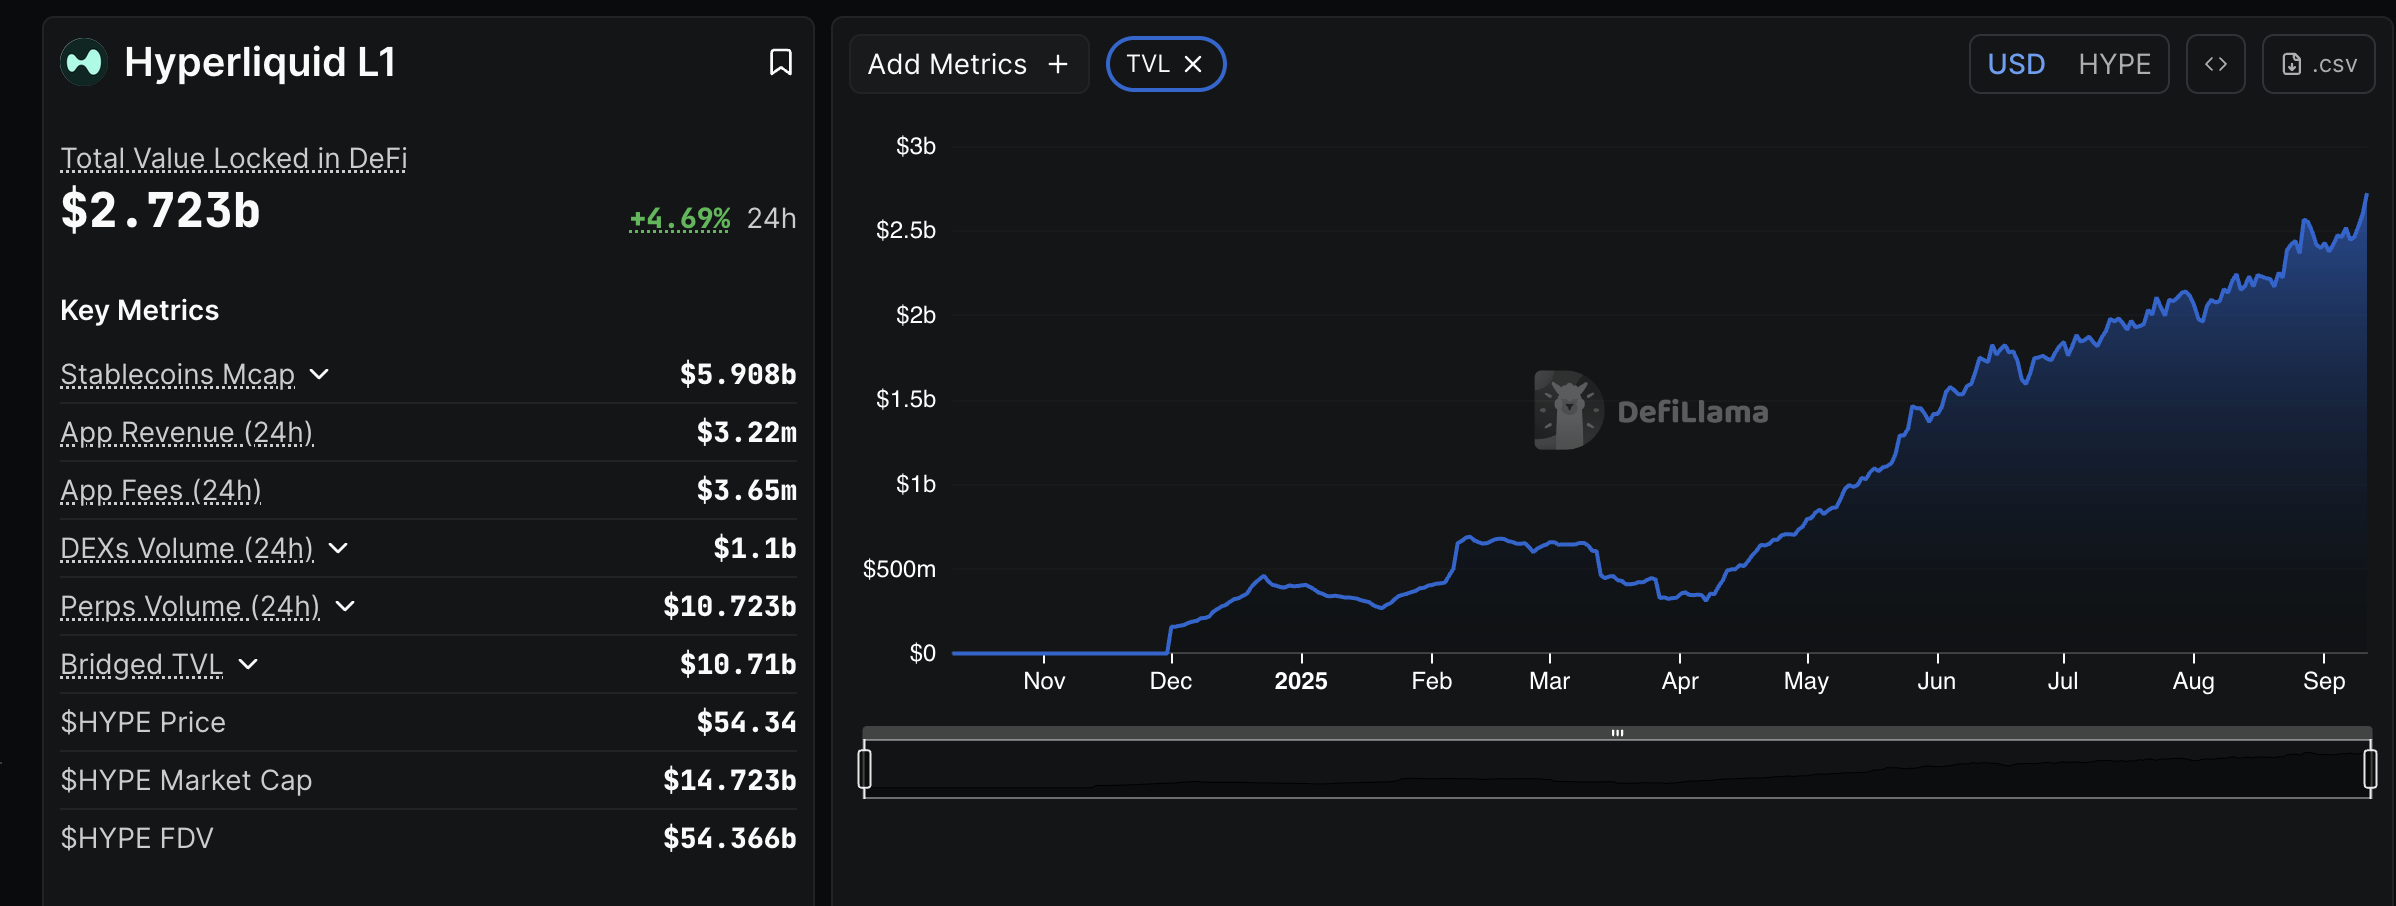
Hyperliquid DeFi TVL | Source: CoinGlass
The stablecoins market capitalisation has also been on a steady uptrend since early April. DeFi Llama data shows the asset classes’ market share on the Hyperliquid protocol at $5.83 billion, representing a 65.9% growth from $1.99 billion recorded on April 1.
Hyperliquid is also planning to launch USDH, a stablecoin native to the protocol, which will boost competition with existing tokens such as USDC and USDT. A higher stablecoin market capitalization, bolstered by USDH capturing a portion of the liquidity currently dominated by USDC, could boost demand for HYPE. Stablecoins are a medium for trading that often attracts more traders and increases trading volume.
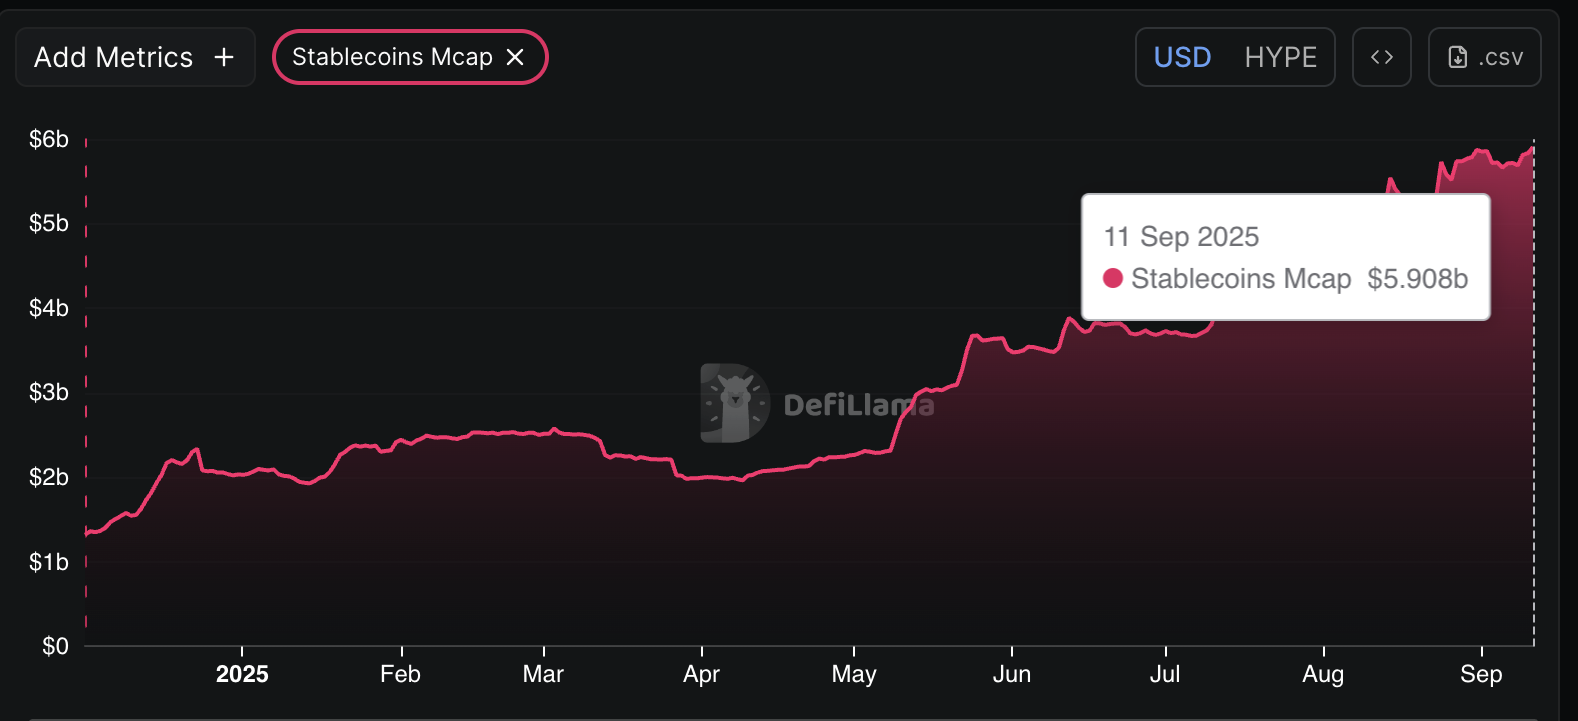
Hyperliquid stablecoin market cap | Source: CoinGlass
Technical outlook: HYPE trims gains amid profit-taking
Hyperliquid’s rally to a new record high of $58.78 is triggering profit-taking and creating volatility on Thursday. The current technical picture risks extending declines toward $50.00, underpinned by a sell signal from the Moving Average Convergence Divergence (MACD) indicator on the 4-hour chart.
A sell signal occurs when the blue MACD line crosses below the red signal line, prompting traders to reduce their exposure.
The Relative Strength Index (RSI), which is currently at 56 after peaking at 78 in overbought territory, reinforces the bearish grip, suggesting that bullish momentum is fading.
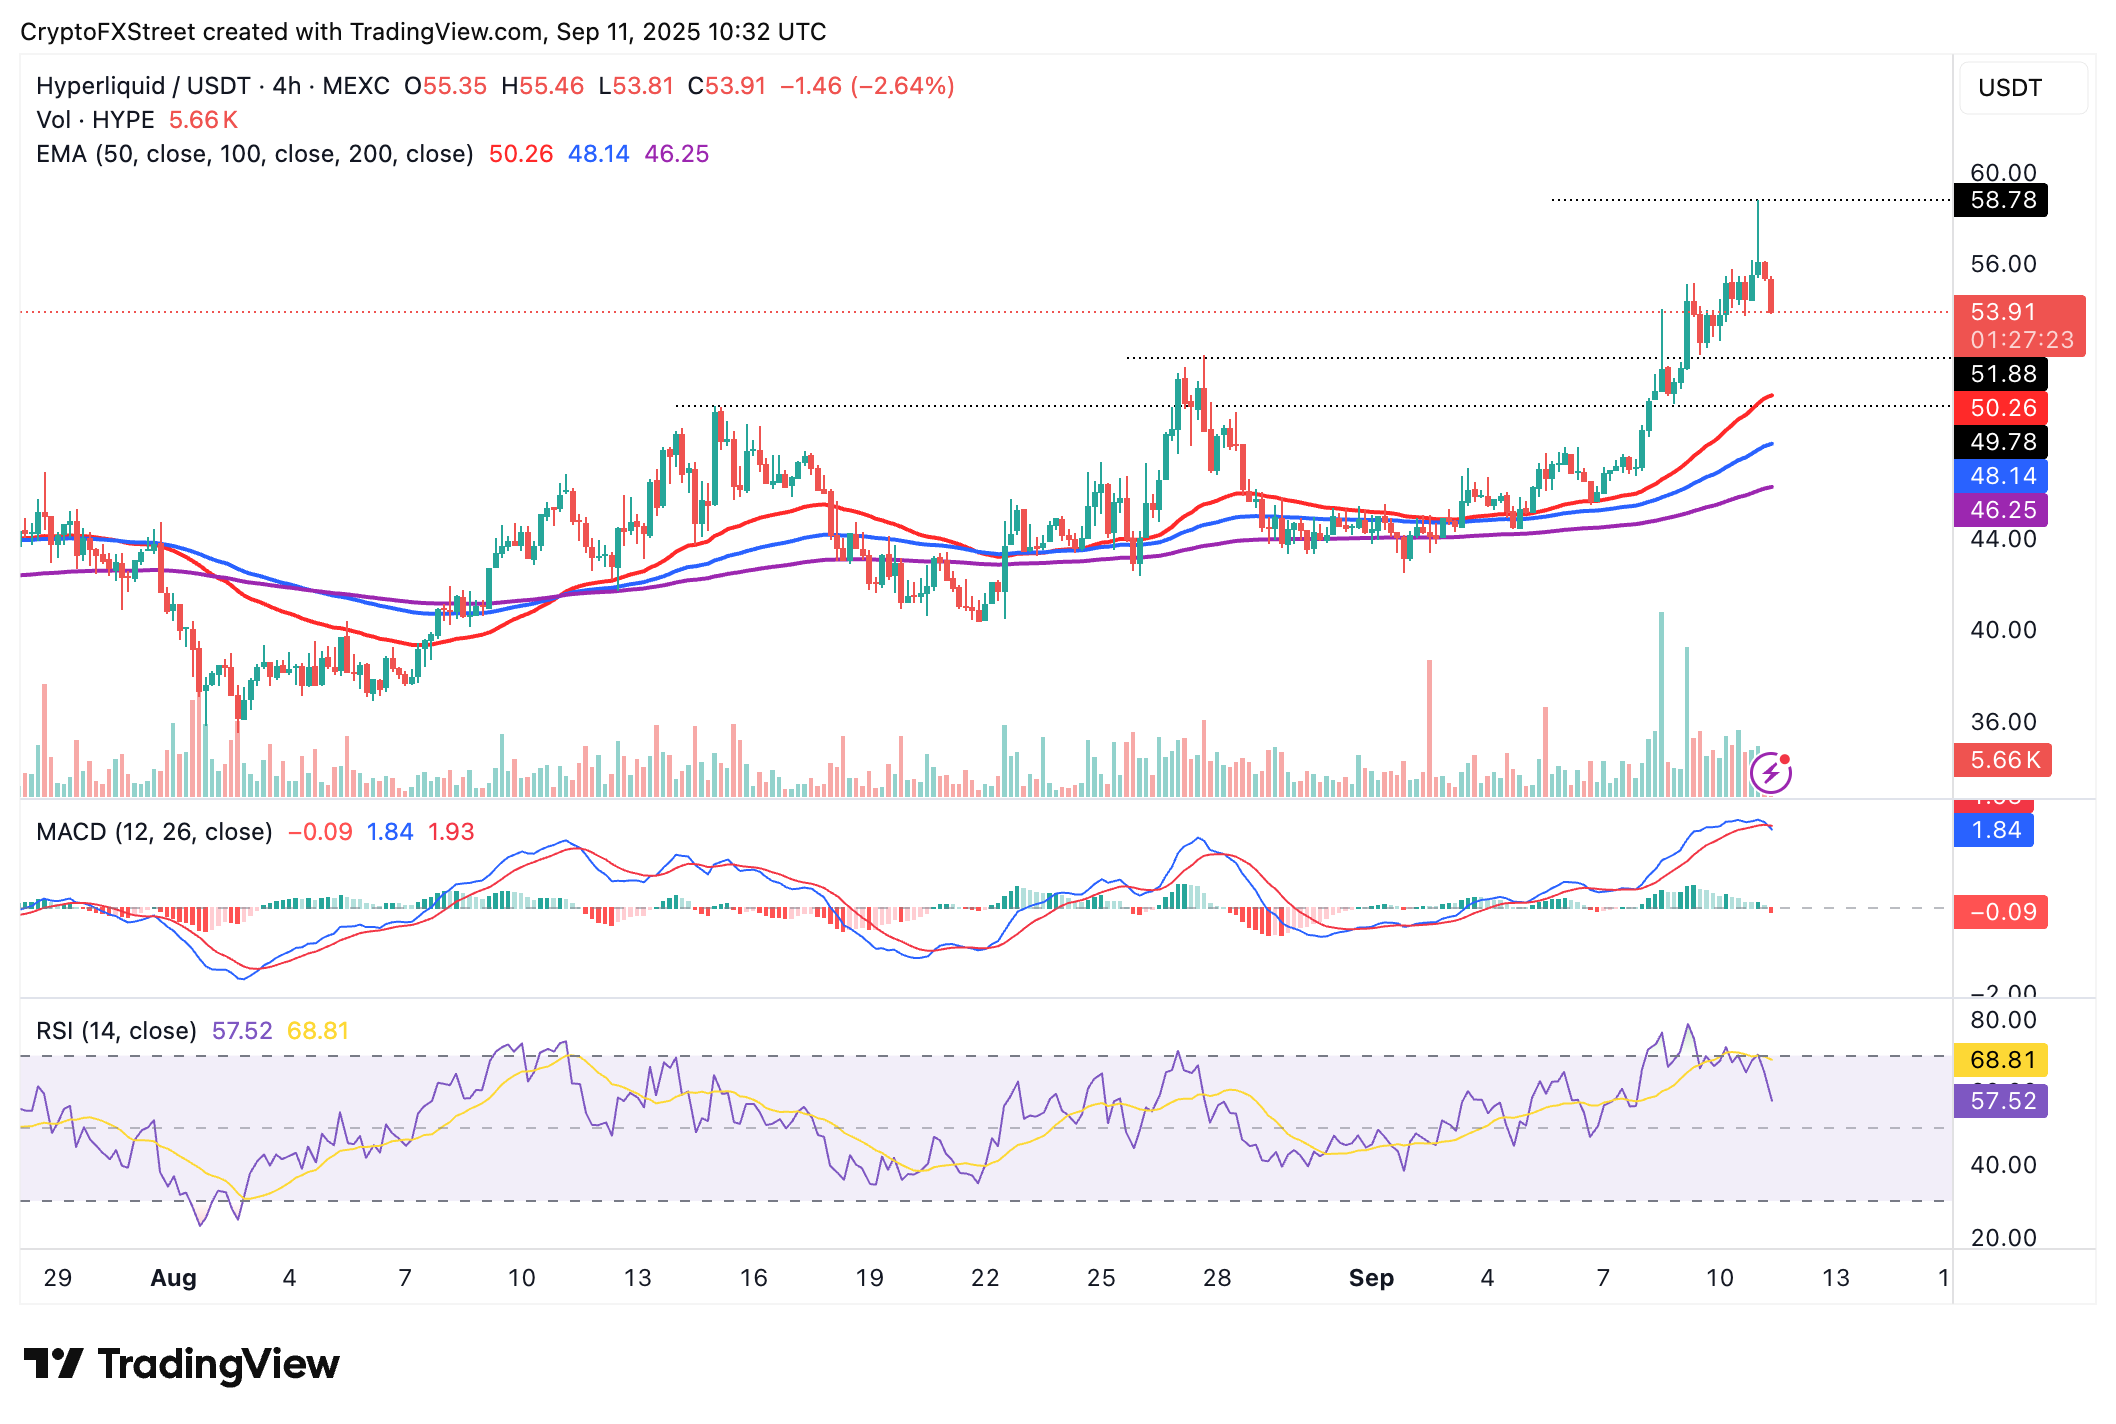
HYPE/USDT 4-hour chart
The path of least resistance remains downward at the time of writing, with traders focusing on the $51.88 level, which was tested as resistance on August 27, the 50-period Exponential Moving Average (EMA) at $50.23, and the 100-period EMA at $48.12. If traders buy the dip, reducing the impact of profit-taking, the Hyperliquid price could resume its uptrend, aiming for a new record high.
Open Interest, funding rate FAQs
Higher Open Interest is associated with higher liquidity and new capital inflow to the market. This is considered the equivalent of increase in efficiency and the ongoing trend continues. When Open Interest decreases, it is considered a sign of liquidation in the market, investors are leaving and the overall demand for an asset is on a decline, fueling a bearish sentiment among investors.
Funding fees bridge the difference between spot prices and prices of futures contracts of an asset by increasing liquidation risks faced by traders. A consistently high and positive funding rate implies there is a bullish sentiment among market participants and there is an expectation of a price hike. A consistently negative funding rate for an asset implies a bearish sentiment, indicating that traders expect the cryptocurrency’s price to fall and a bearish trend reversal is likely to occur.
Author

John Isige
FXStreet
John Isige is a seasoned cryptocurrency journalist and markets analyst committed to delivering high-quality, actionable insights tailored to traders, investors, and crypto enthusiasts. He enjoys deep dives into emerging Web3 tren



