Hyperliquid Price Forecast: HYPE braces for extended dip as funding rate and open interest shrink
- Hyperliquid falls sharply from its record high of $51.51, testing the 200-period EMA on the 4-hour chart.
- Hyperliquid retail demand at risk as futures funding rate and Open Interest shrink.
- The MACD and RSI indicators reinforce the bearish grip.

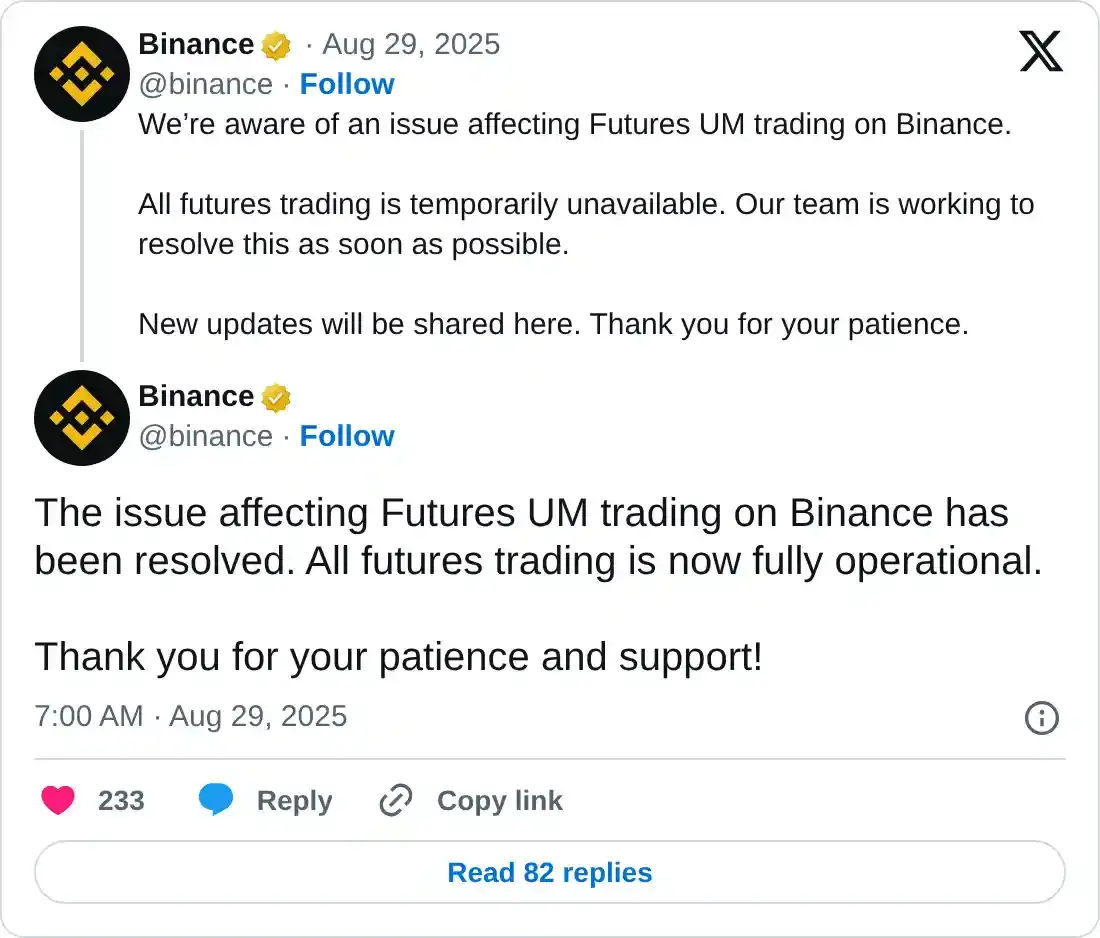
Hyperliquid (HYPE) edges lower, trading at $44.23 on Friday amid rampant selling in the broader cryptocurrency market. News about the suspension of Binance futures trading sent jitters across the market, triggering risk-off sentiment.
Although officials of the exchange confirmed that the contract transfer service had been restored, market sentiment remains dull amid the lack of catalysts to erase the losses.
Hyperliquid faces risk-off sentiment as Open Interest dips
The hyperliquid derivatives market is showing signs of weakness as risk-off sentiment spreads in the broader cryptocurrency market. The futures Weighted Funding Rate metric currently averages at 0.0087% down from Sunday’s 0.0269% and 0.0768% recorded on July 21.
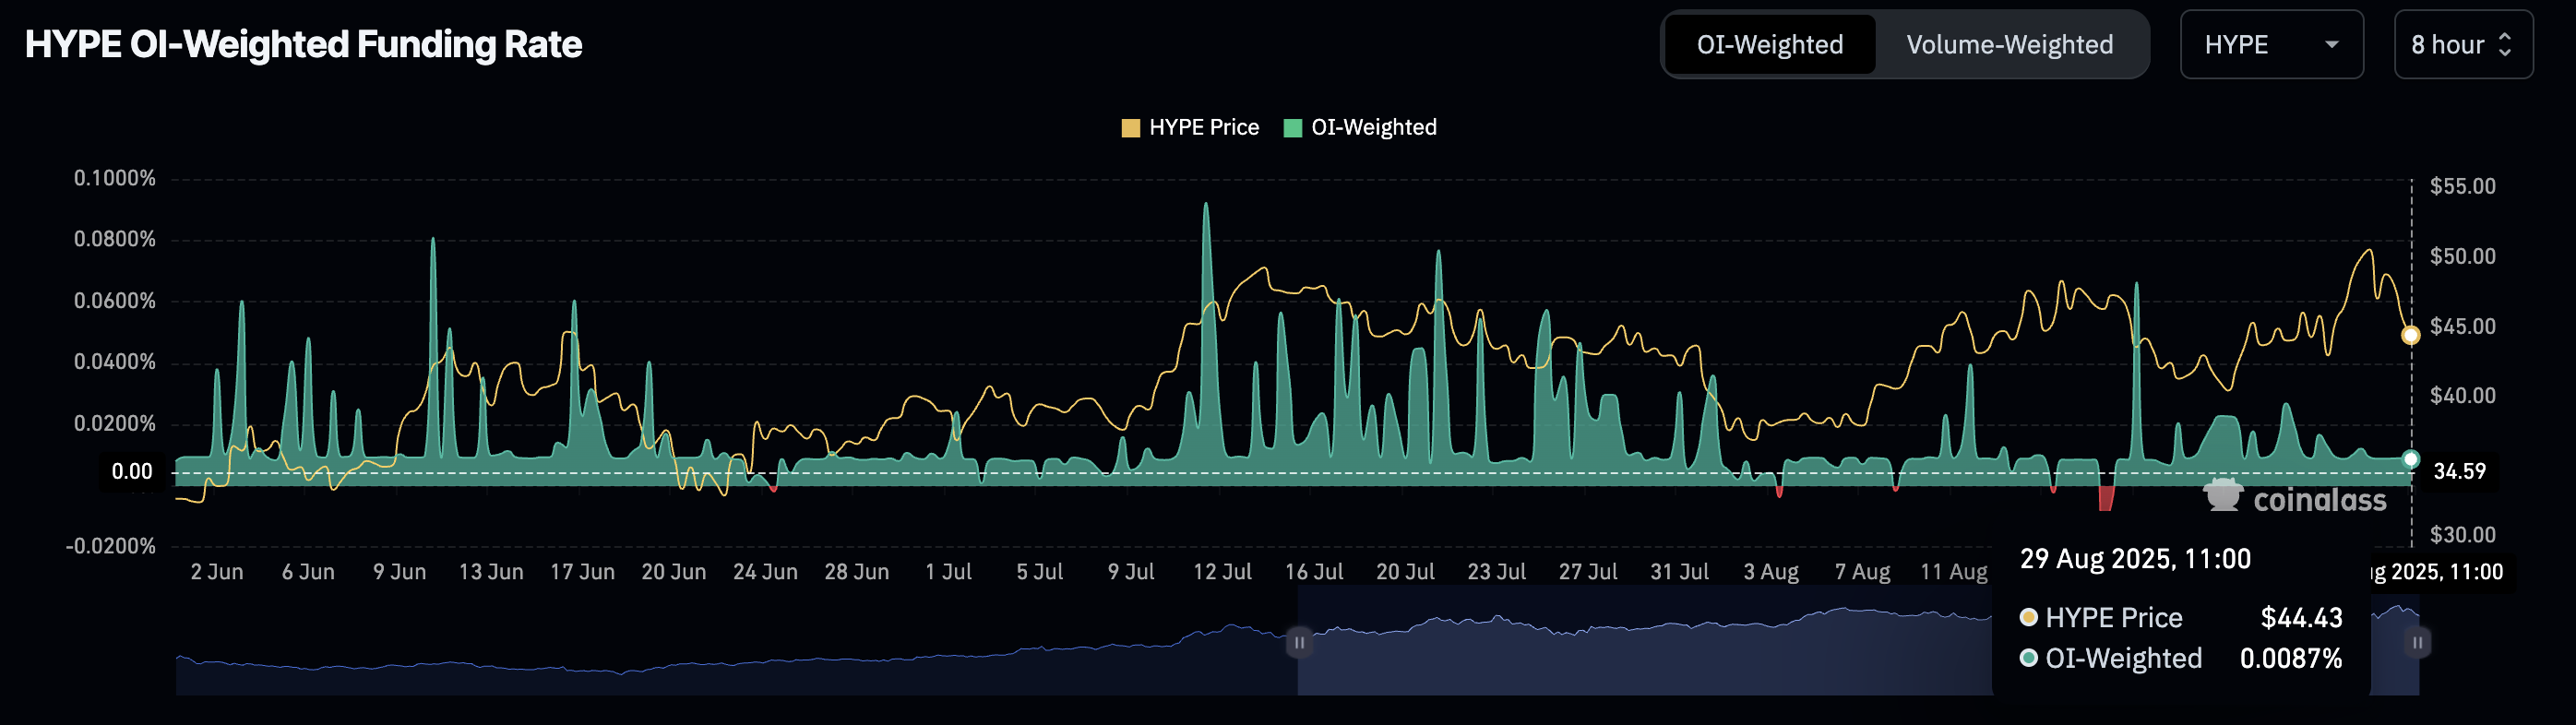
Hyperliquid Futures Weighted Funding Rate | Source: CoinGlass
Low funding rates signal bearish sentiment as fewer traders are leveraging long positions. Coupled with declining futures Open Interest (OI), this situation could have an extended negative impact on the HYPE price performance.
After peaking at $2.23 billion on Wednesday, the OI representing the value of outstanding futures contracts stands at $2 billion. If the correction persists, it would signal a reduction in investor confidence, leaving Hyperliquid susceptible to selling activity.
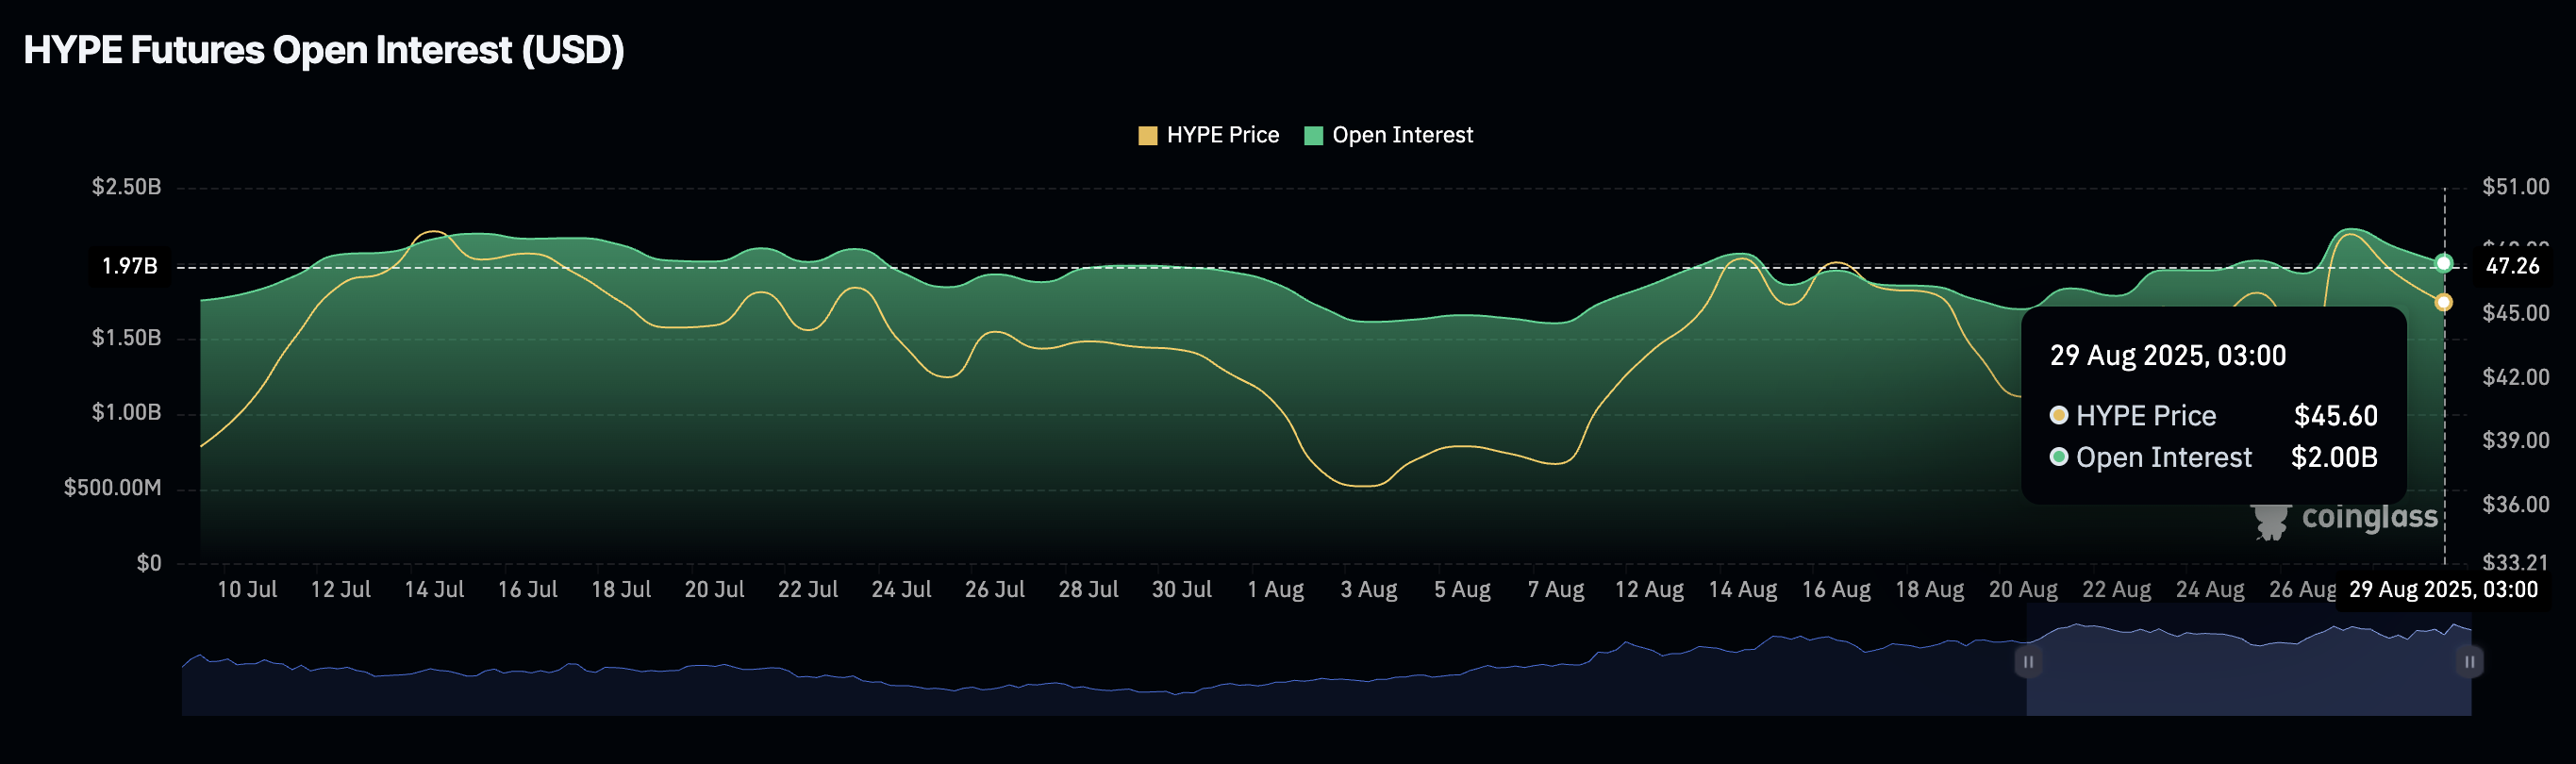
Hyperliquid Futures Open Interest | Source: CoinGlass
Hyperliquid’s 13% drop from its record high of $51.15 also triggered liquidations totaling $1.67 million in long positions and approximately $16,000 in shorts.
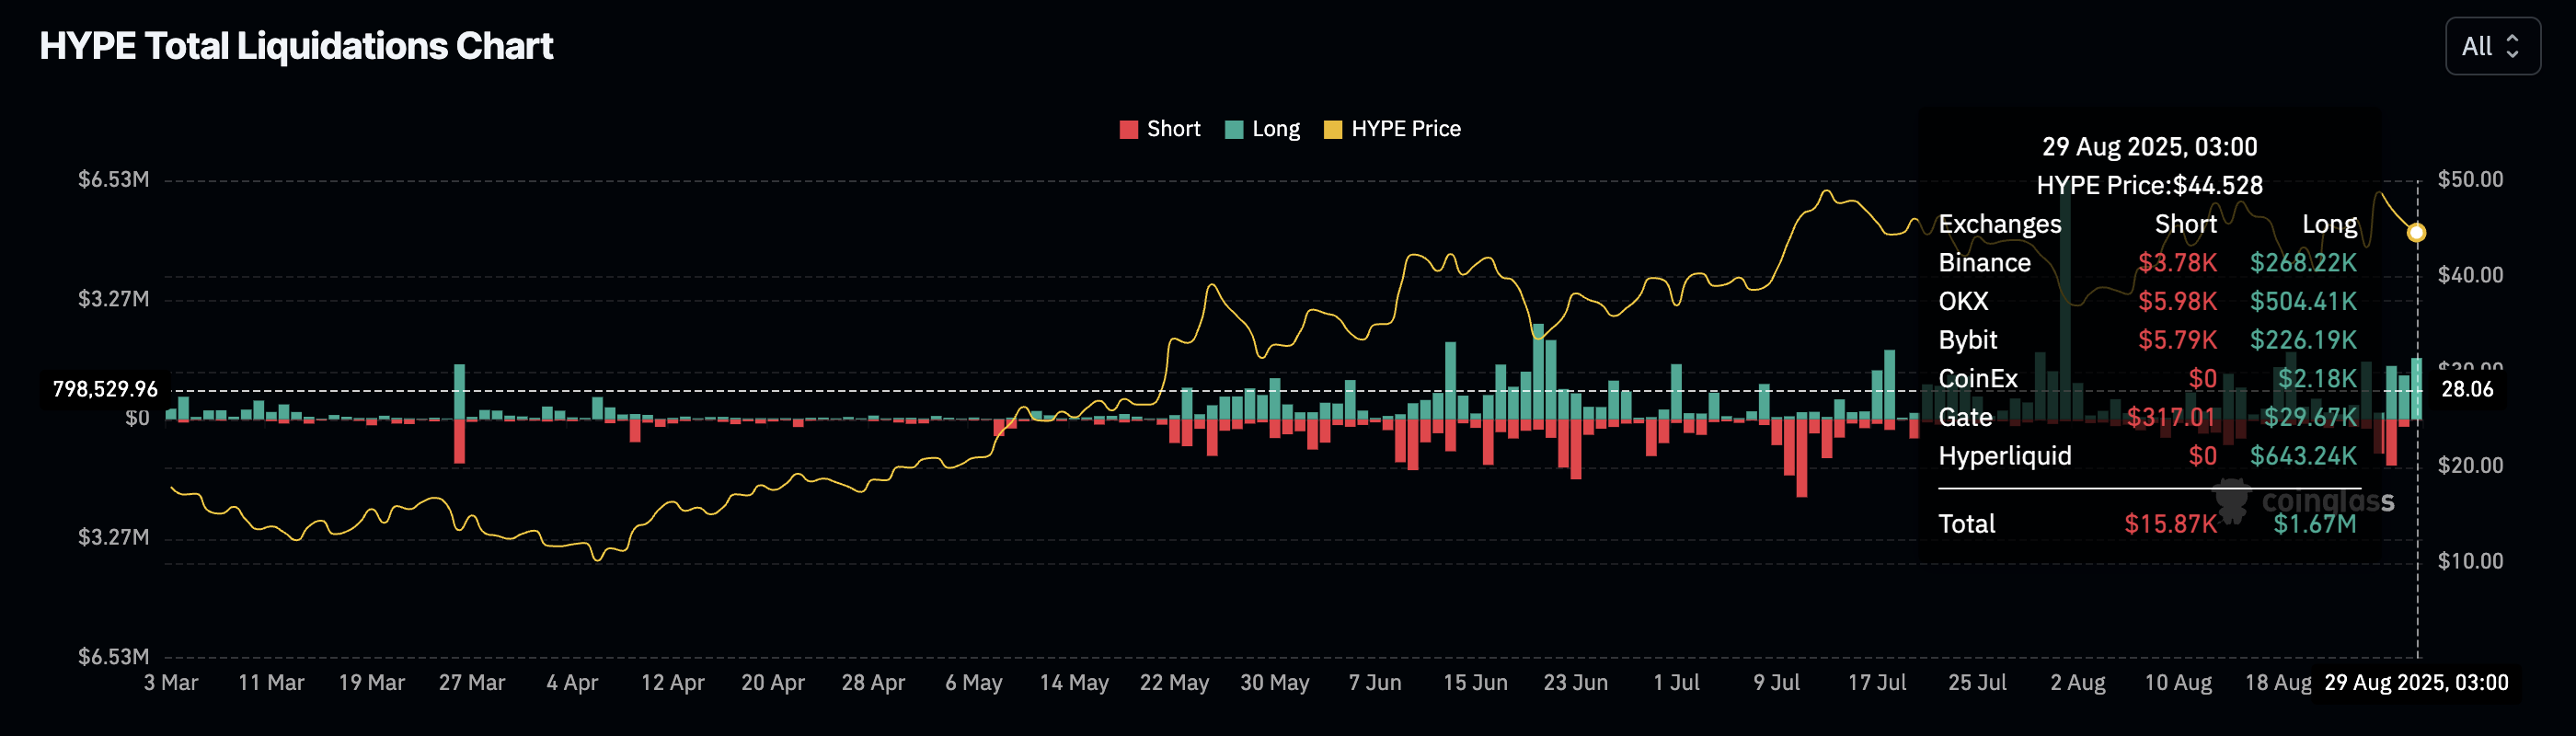
Hyperliquid Futures Liquidations | Source: CoinGlass
Technical outlook: Hyperliquid bears tighten grip
Hyperliquid shows little to no signs of recovery at the time of writing as it tests the 200-period Exponential Moving Average (EMA) on the 4-hour chart. Attempts to uphold higher support levels, as provided by the 50-period EMA at $45.81 and the 100-period EMA at $44.95, ended in futility.
The Moving Average Convergence Divergence (MACD) indicator displays a sell signal triggered on Thursday. Traders will likely reduce exposure as long as the blue MACD line remains below the red signal line and the red histogram bars expand below the mean line.
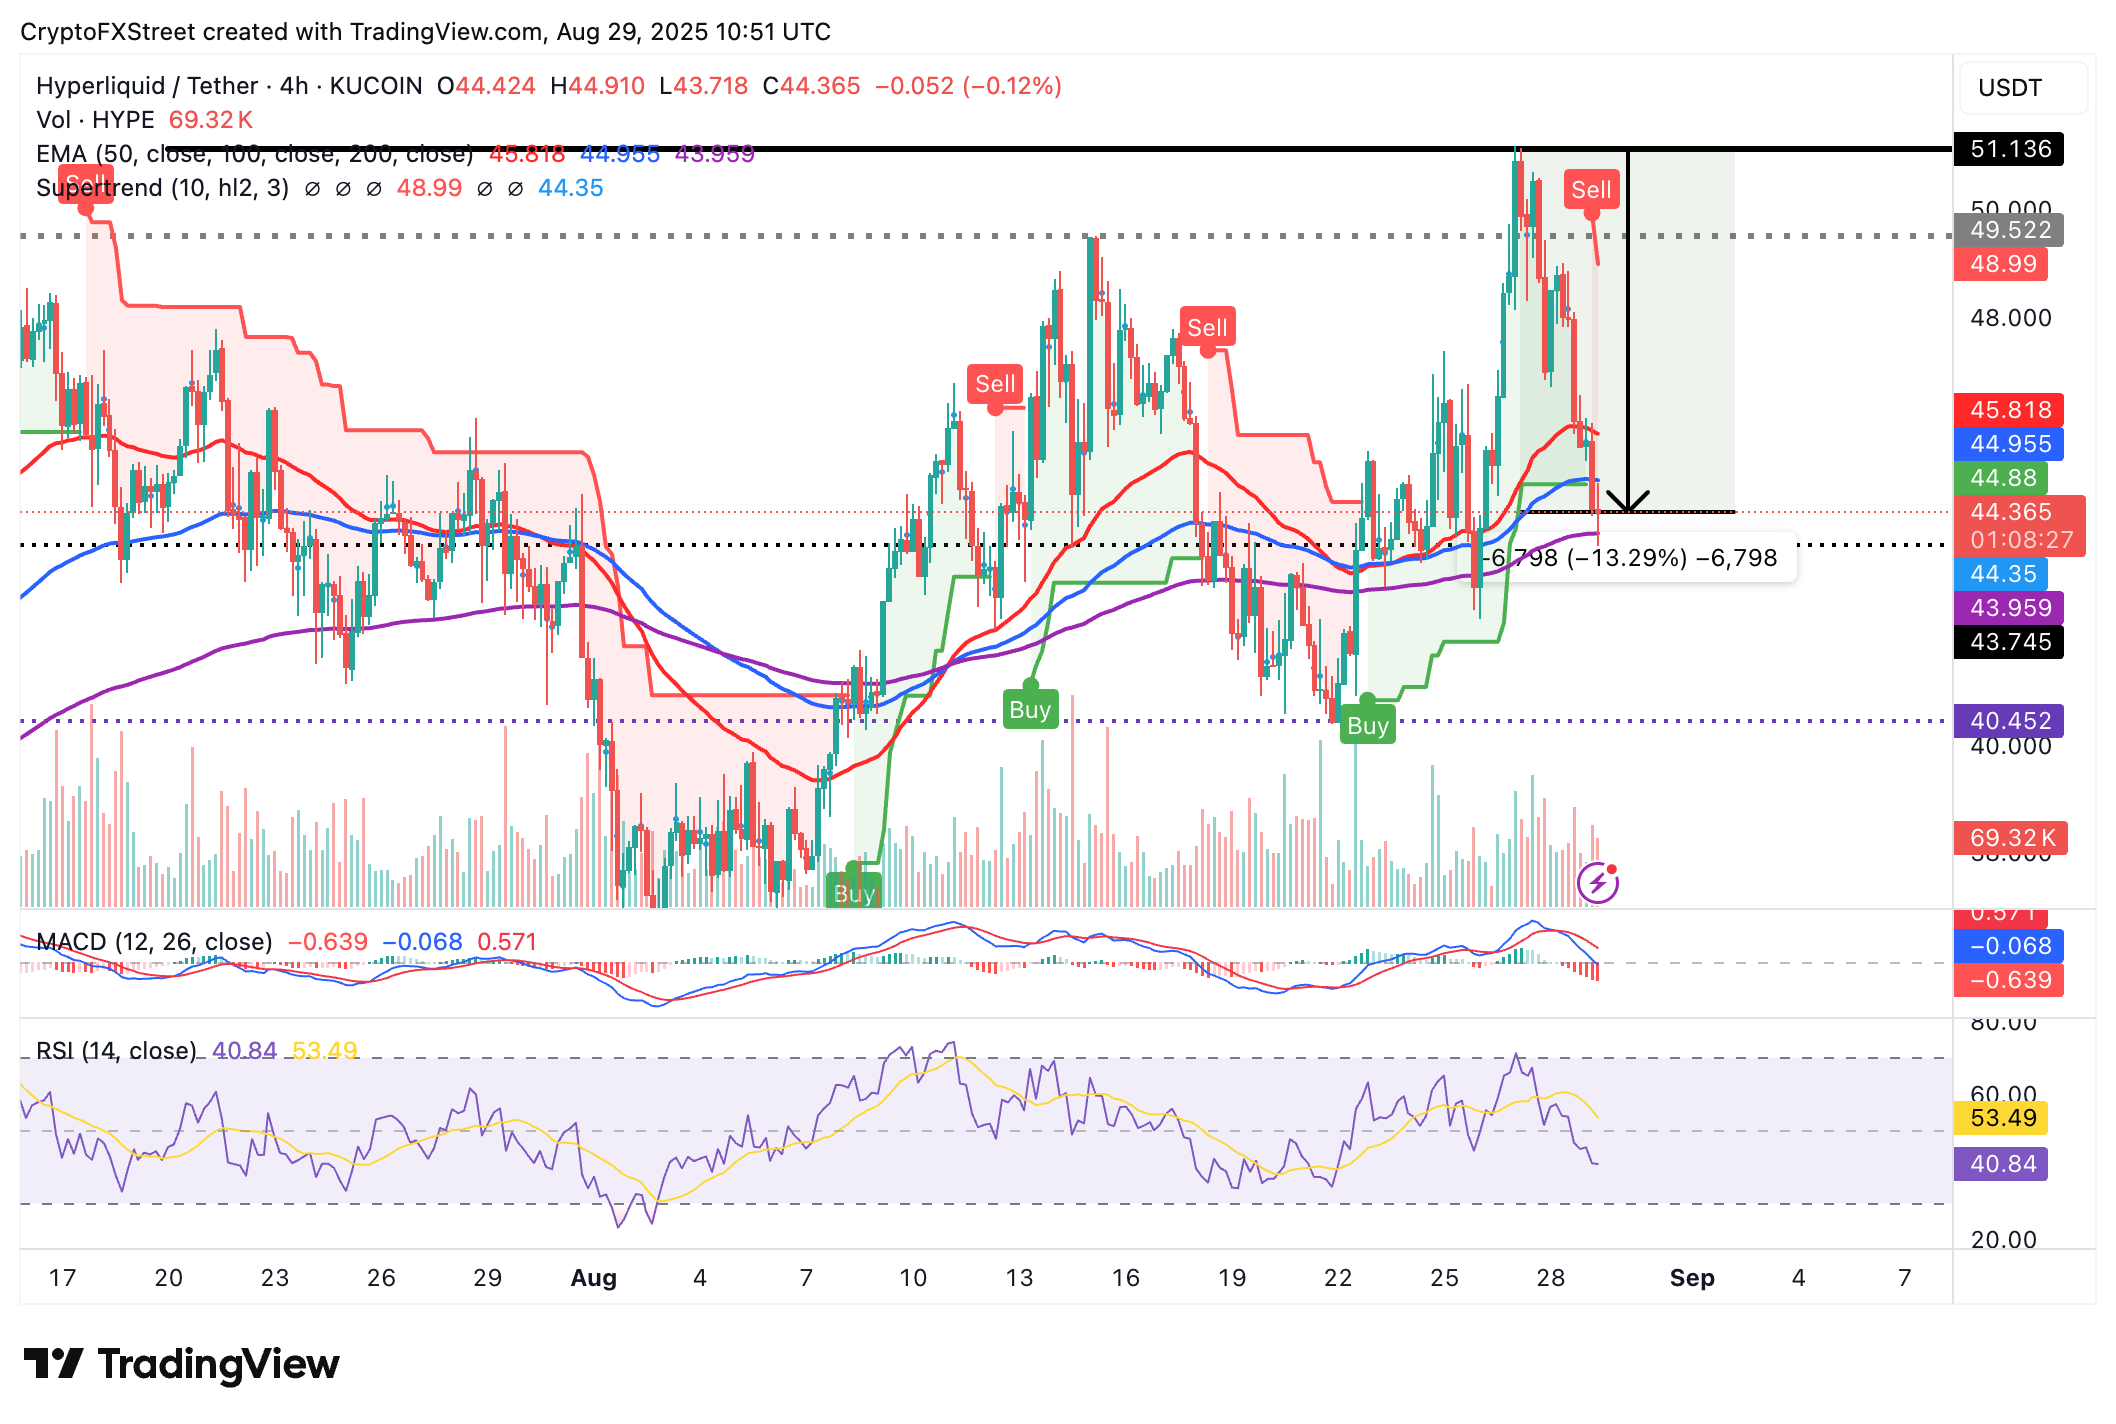
HYPE/USDT 4-hour chart
Buying pressure remains significantly suppressed as the Relative Strength Index (RSI) at 40 declines toward oversold territory. The 200-period EMA at $43.95 is critical for the resumption of the uptrend.
Still, if selling pressure continues to overwhelm demand, the path of least resistance would lean downward. The support at $40.00 tested on Friday could absorb the selling pressure ahead of a potential rebound.
Open Interest, funding rate FAQs
Higher Open Interest is associated with higher liquidity and new capital inflow to the market. This is considered the equivalent of increase in efficiency and the ongoing trend continues. When Open Interest decreases, it is considered a sign of liquidation in the market, investors are leaving and the overall demand for an asset is on a decline, fueling a bearish sentiment among investors.
Funding fees bridge the difference between spot prices and prices of futures contracts of an asset by increasing liquidation risks faced by traders. A consistently high and positive funding rate implies there is a bullish sentiment among market participants and there is an expectation of a price hike. A consistently negative funding rate for an asset implies a bearish sentiment, indicating that traders expect the cryptocurrency’s price to fall and a bearish trend reversal is likely to occur.
Author

John Isige
FXStreet
John Isige is a seasoned cryptocurrency journalist and markets analyst committed to delivering high-quality, actionable insights tailored to traders, investors, and crypto enthusiasts. He enjoys deep dives into emerging Web3 tren


