How to profitably trade Shiba Inu price despite the bear infestation
- Shiba Inu price has dropped roughly 9% in 24 hours, suggesting sellers are in control.
- Investors can expect this downswing to continue until SHIB revisits the $0.0000101.
- A breakdown of the $0.0000101 support level can trigger a 26% crash to $0.0000074.

Shiba Inu price has been hovering inside a technical formation that forecasts a bearish outlook for the most part. However, the confirmation has not yet arrived, so the possibility of an upswing also exists.
Shiba Inu price at decisive moment
Shiba Inu price has produced four distinctive lower highs since May 13. For each of these swing lows, the meme coin has produced nearly equal lows around $0.0000101. Connecting these swing points using trend lines reveals a descending triangle.
This technical formation forecasts a 26% move in either direction, however, the consolidative formation has a tendency to resolve to the downside. If a breakdown of the lower trend line occurs, it targets $0.0000074; on the other hand, a bullish breakout could trigger a 26% rally to $0.0000150.
While the recent crash might seem bearish at first look, the one-month history reveals that SHIB buyers seem to be stepping in and bidding between the $0.0000106 and $0.0000101 levels. Therefore, a bounce here seems likely and could propel Shiba Inu price to the upper trend line of the descending triangle around $0.0000114.
If these bulls take it up a notch and push the Dogecoin-killer to produce a four-hour candlestick close above the technical formation’s upper trend line, it will signal a bullish breakout, propelling SHIB to the theoretical target at $0.0000150. In total, this move would constitute a 47% gain.
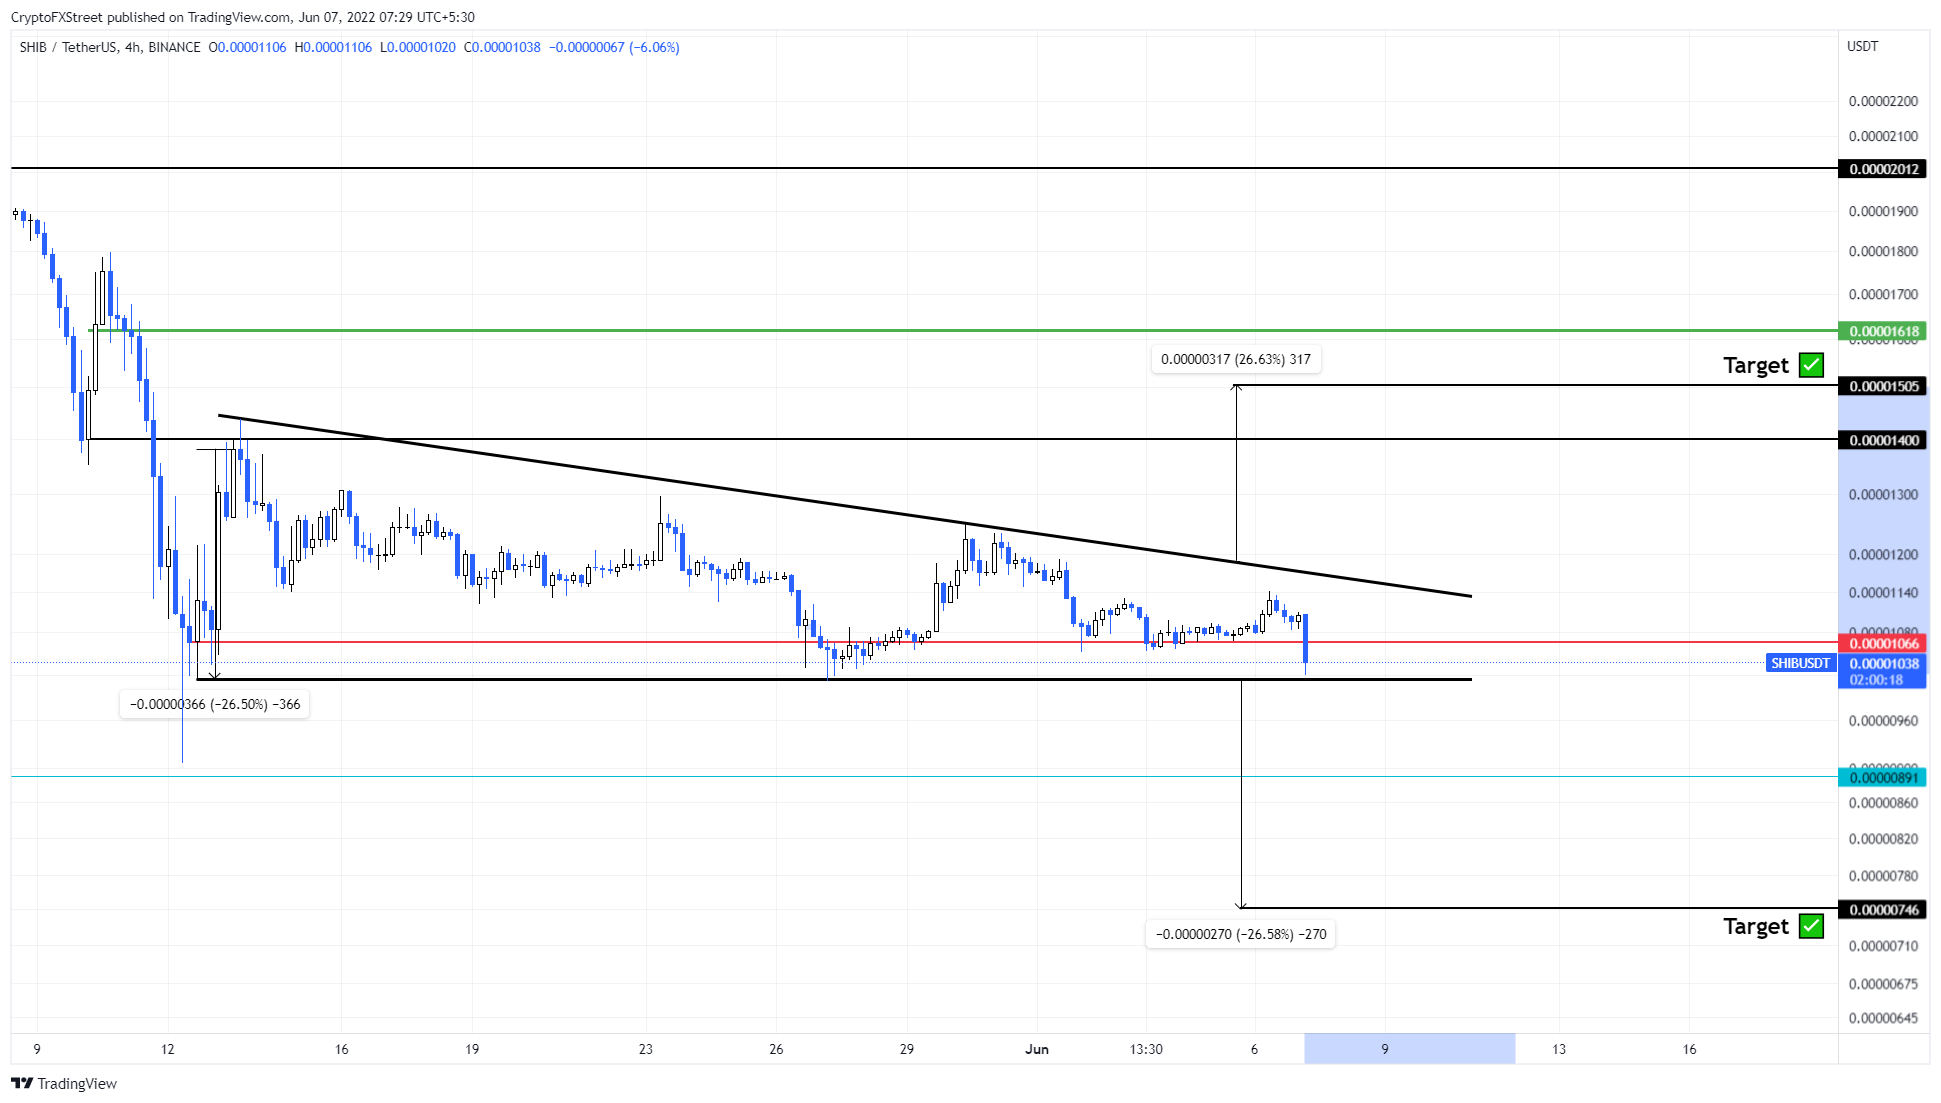
SHIB/USDT 4-hour chart
On the other hand, if Shiba Inu price produces a four-hour candlestick close below the descending triangle’s base at $0.0000101, it will invalidate the bullish thesis and trigger a bearish one.
In such a case, investors can expect Shiba Inu price to crash to $0.0000074 with a potential pause at $0.0000089.
Author

Akash Girimath
FXStreet
Akash Girimath is a Mechanical Engineer interested in the chaos of the financial markets. Trying to make sense of this convoluted yet fascinating space, he switched his engineering job to become a crypto reporter and analyst.




