How sustainable is the Robinhood induced Shiba Inu price rally
- Shiba Inu price has begun its capital-doubling rally after getting listed on Robinhood on April 12.
- SHIB team has also launched a metaverse, which is acting as a tailwind to the ongoing upswing.
- A daily candlestick close below $0.0000211 will invalidate the bullish thesis.
Shiba Inu price is near the upper end of completing a bottom reversal setup. The recent upgrade for the meme coin has more than helped the technical aspects and in kick-starting the uptrend.
Robinhood silently listed Shiba Inu on April 12 and produced a blog a bit later. This has been the most anticipated listing since May 2021. The announcement added,
As a safety-first company, we have a rigorous framework in place to help us evaluate assets for listing, and we remain committed to providing a safe and educational crypto platform.
Shiba Inu price forms a base before next leg-up
Shiba Inu price rose a whopping 36% after the Robinhood listing but settled at 22% on the daily candlestick close. This initial upthrust is crucial and is key in kick-starting the upswing that forecasts a move to $0.0000454.
The Shiba Inu price action since January 4 set up an Adam and Eve setup, which contains a V-shaped valley followed by a rounding bottom. This technical formation forecasts a 38% upswing, obtained by measuring the valley’s depth and adding it to the breakout point at $0.0000329.
So far, Shiba Inu price has rallied 22% and is close to reaching the ceiling at $0.0000329. A daily candlestick close above this barrier will indicate a breakout and kick-start a move to the target at $0.0000454. However, there are chances this upswing could extend to $0.0000500 due to it being a round number.
In this case, the run-up would constitute an 87% upswing from the current position at $0.0000266 and 126% from the pre-Robinhood listing price at $0.0000221 on April 11.
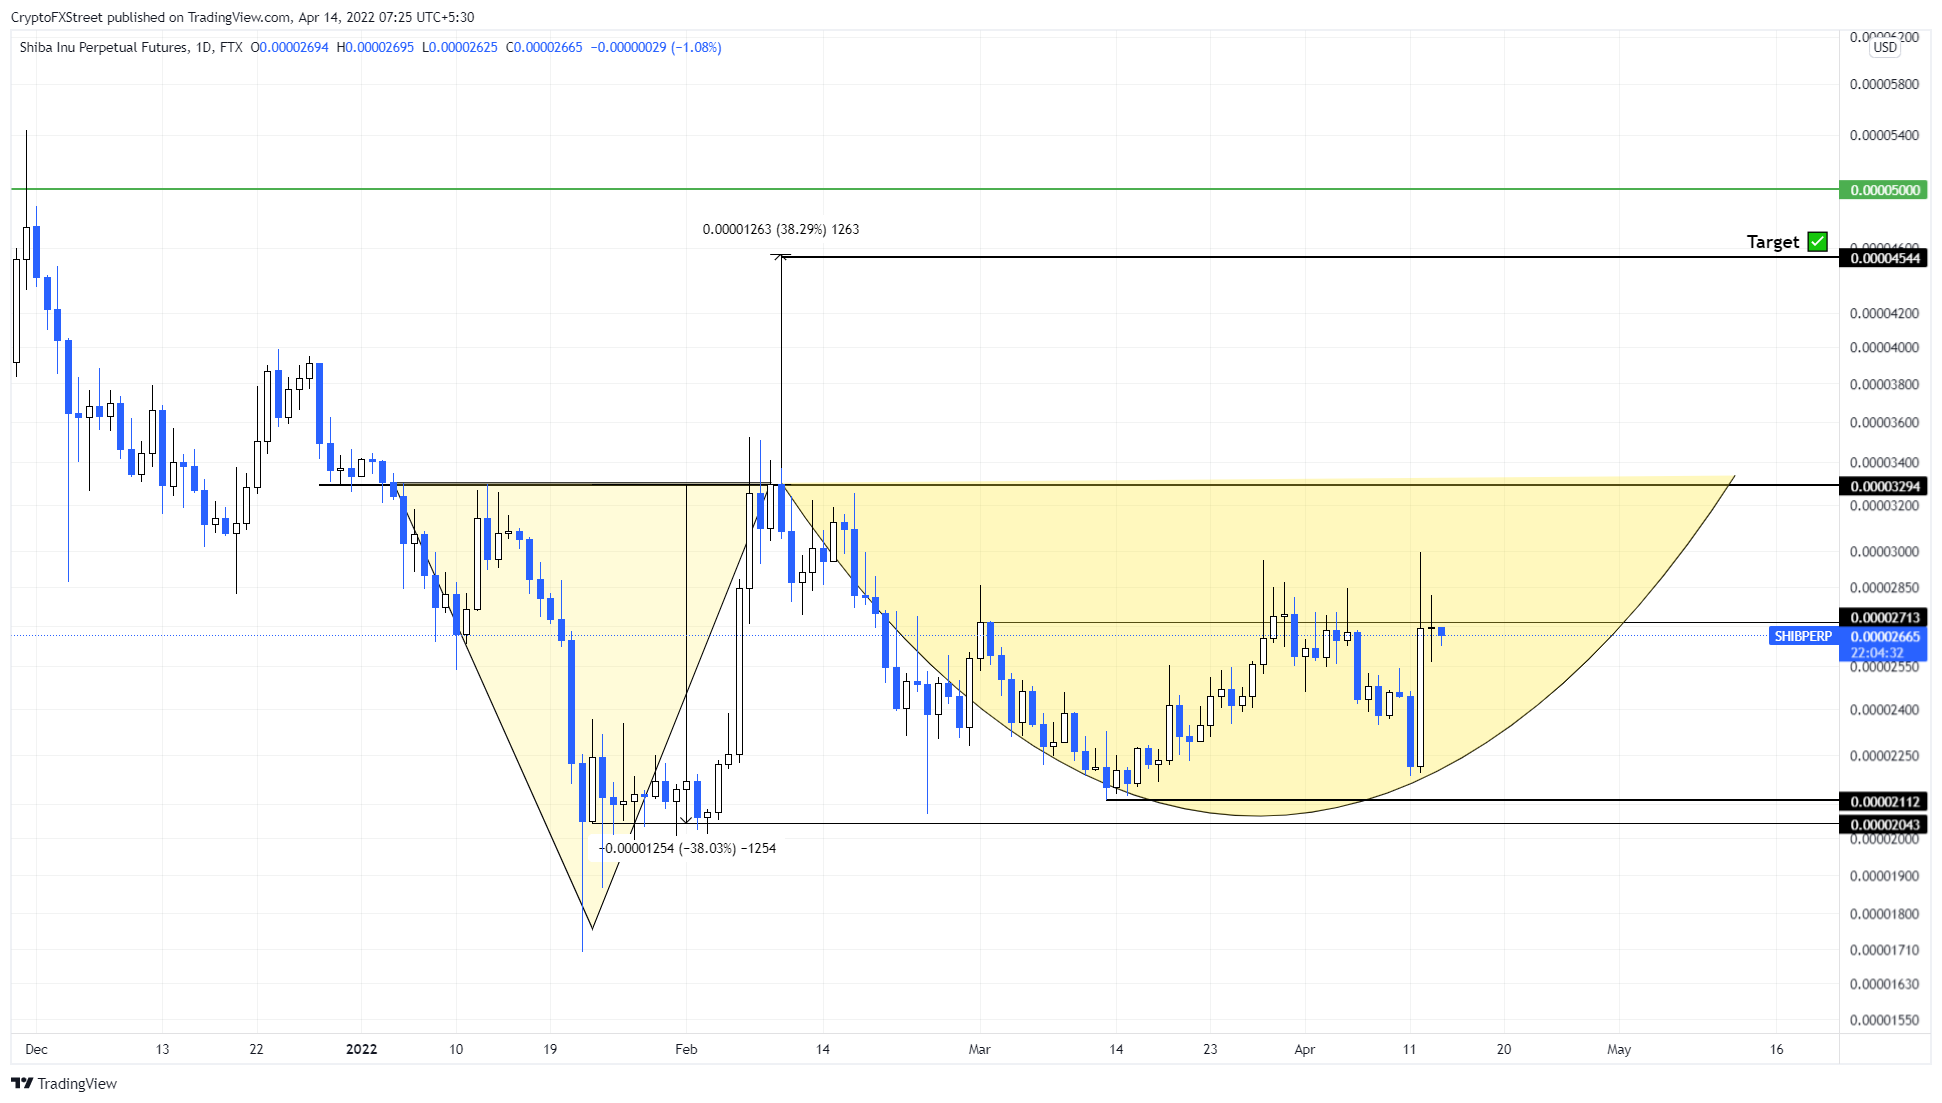
SHIB/USDT 1-day chart
While things are looking up for Shiba Inu price, a daily candlestick close below $0.0000211 will invalidate the bullish thesis for SHIB by producing a lower low. In such a case, SHIB might slide lower to explore a stable support level at $0.0000204.
Author

Akash Girimath
FXStreet
Akash Girimath is a Mechanical Engineer interested in the chaos of the financial markets. Trying to make sense of this convoluted yet fascinating space, he switched his engineering job to become a crypto reporter and analyst.


