Here is how long-term Bitcoin holders are fueling the ongoing BTC price rally
- Bitcoin's selected on-chain metrics reveal that HODLing is the new strategy for investors.
- The aSOPR has hit levels of 0.98, showing that fewer old and profitable coins have been spent.
- BTC macro perspective remains strong, especially with Goldman Sachs restarting the trading desk.
- Bitcoin must hold above the 50 SMA on the 4-hour chart to avoid losses towards $44,000 support.

Bitcoin briefly reclaimed the position above $50,000 on Monday, suggesting that the uptrend and the bull cycle are still intact. Selected on-chain metrics such as the Adjusted Spent Outputs Profit Ratio (aSOPR) and the Liquid Supply change reveal that investor sentiment is higher as long-term holding emerges as a preferred strategy.
Bitcoin Adjusted Spent Outputs Profit Ratio resets
The Adjusted Spent Outputs Profit Ratio has reset under 1.0 for the first time since the ongoing bull run started, hitting a value of 0.98. The Entity ASOPR tracks all the coins spent daily and measures the extent of profit or loss compared to when these coins last moved.
Note that when the aSOPR has a value less than 1.0, it reveals that the average volume of the coins transacted on the day was at a loss. Simultaneously, an aSOPR value of 1.0 or less suggests that fewer old and profitable coins were spent. In other words, investor confidence is growing hence the holding longer (HODL).
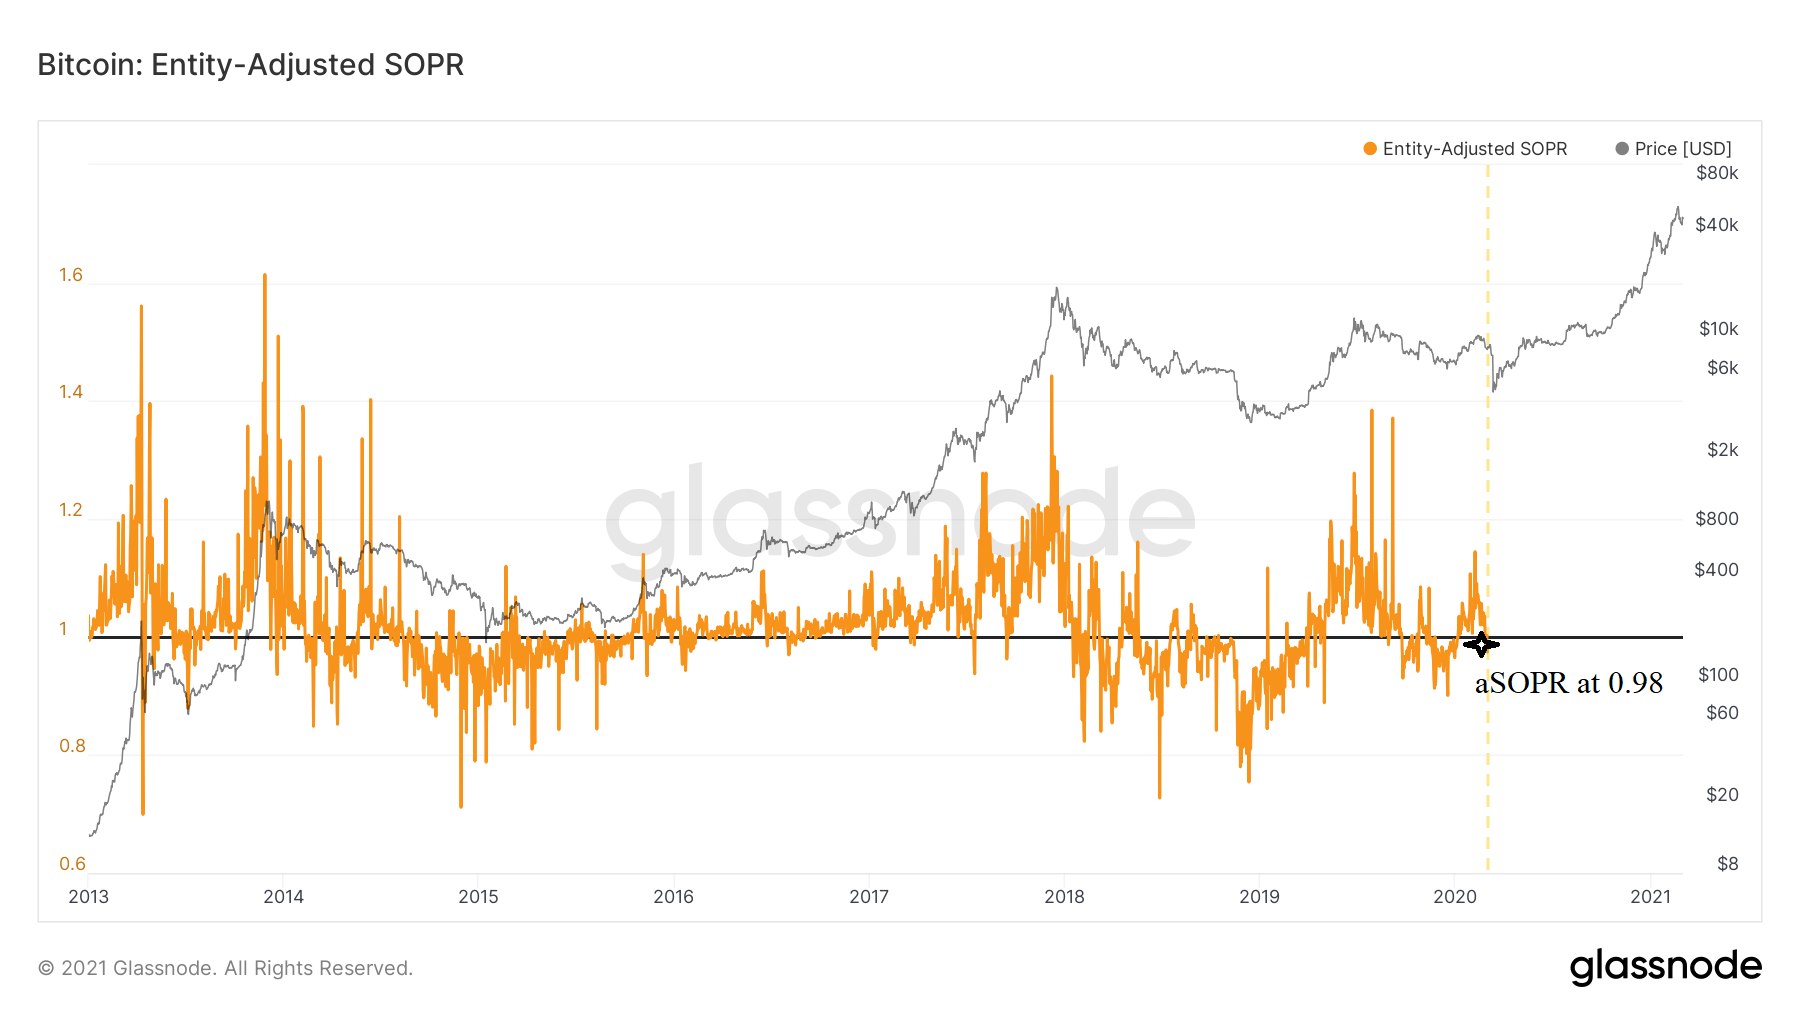
Bitcoin aSOPR chart
Bitcoin coin continues to experience consistent outflow from exchanges to illiquid status. It is essential to keep in mind that this exodus of coins began in March 2020. The increase in long-term holders shows that Bitcoin is growing as a vital macro asset.
On the one hand, on-chain metrics are resetting, which means that correction may continue in the near term. On the other hand, the increase in the investors' risk appetite shows that the bull cycle is still intact.
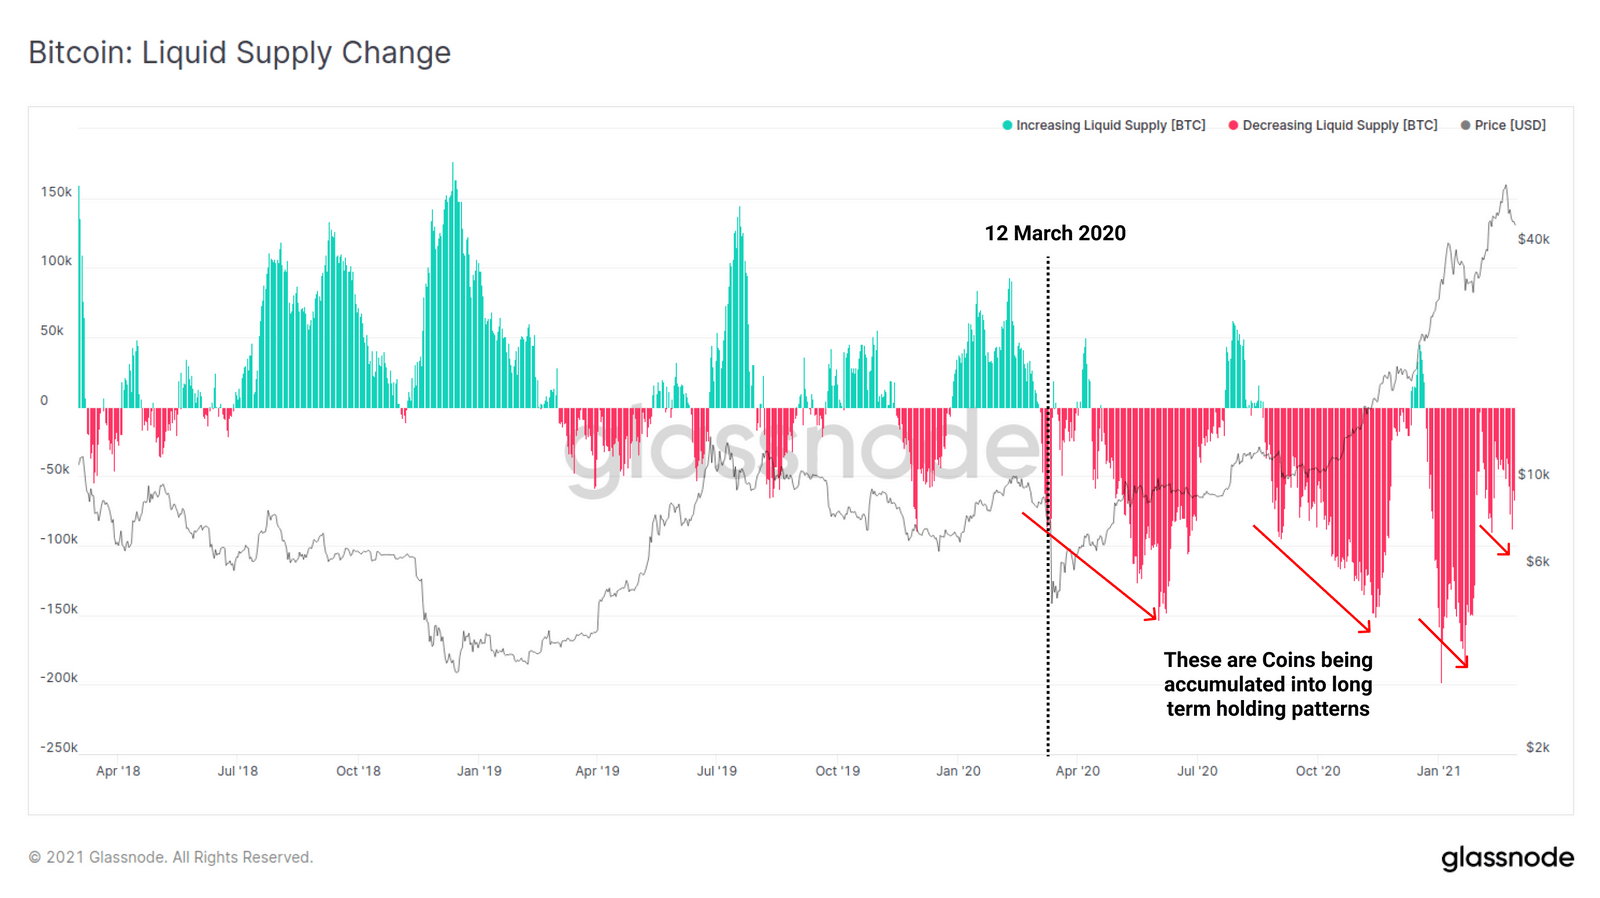
Bitcoin liquid supply change
Bitcoin macro environment is flipping massively bullish
According to Citi Group's recent report, Bitcoin is showing growing adoption levels, particularly around businesses. For instance, 36% of all small-medium businesses in the United States are currently accepting Bitcoin as means of payment. Moreover, institutional interest in BTC has escalated during the bull run. Leading global companies like Tesla have added Bitcoin to their balance sheets while other firms like MicroStrategy increase their stake in the pioneer cryptocurrency. The institutional interest in Bitcoin has been reflected by the 250% surge in open interest in CME's Bitcoin futures between October 2020 and January 2021.
Citi Group also confirmed the above on-chain metrics with a report on the long-term holding trend for Bitcoin. Currently, the trend has shifted to five years or longer for those holding the bellwether cryptocurrency.
Goldman Sachs reopens trading desk
Goldman Sachs, a leading investment bank in the US, has announced the reopening of its Bitcoin trading desk. The Wall Street giant is set to begin buying and selling Bitcoin futures and other related products by mid-March.
The desk had been opened in 2018 but was closed. This reentrance into the cryptocurrency market follows a remarkable rally from late 2020. Besides Goldman Sachs, MasterCard said that it was planning on allowing customers to transact in cryptocurrency using its network.
CBORE files for a Bitcoin ETF approval
The Chicago Board Options Exchange (CBOE) has filed with the Securities and Exchange Commission (SEC) to list the shares of VanEck's BTC exchange-traded fund (ETF). If the regulator reviews and approves this proposal, it will mark the first BTC ETF in the United States. The move would be a great boost for Bitcoin by validating maturity and status as a regulated asset.
Bitcoin stalls under $50,000
The leading cryptocurrency by market capitalization is trading marginally above $49,000. As mentioned, the break above $50,000 was brief. The 50 Simple Moving Average (SMA) on the 4-hour chart provides immediate support. On the other hand, the Moving Average Convergence Divergence (MACD) hints at the uptrend continuing in the near-term.
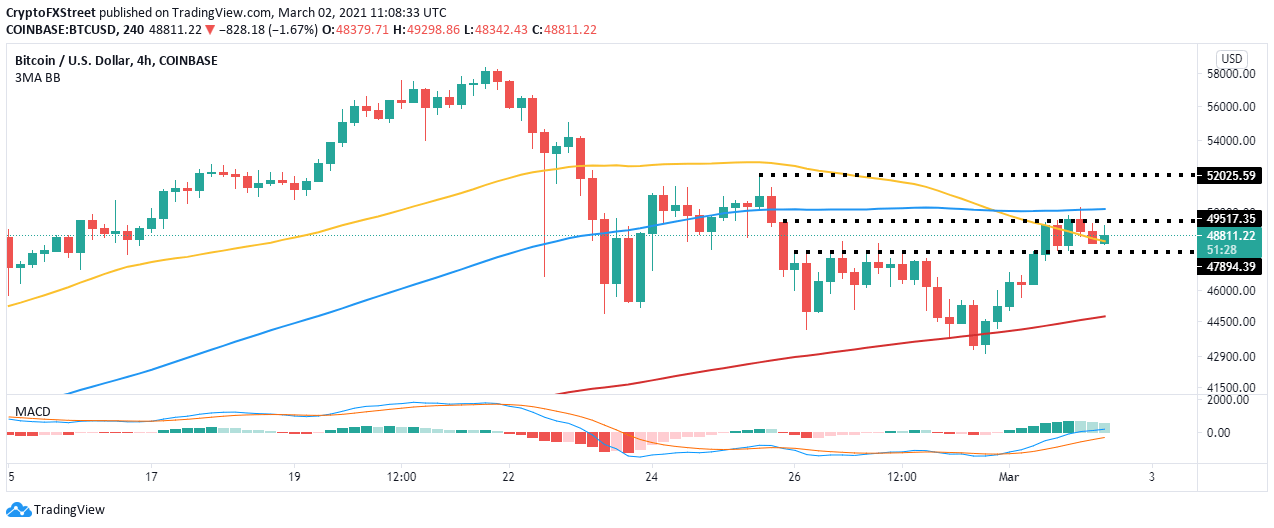
BTC/USD 4-hour chart
Closing the day under the 50 SMA could see Bitcoin flip bearish. Another support is expected at $48,000, but losses could soar toward the 200 SMA on the 4-hour chart if shattered.
Author

John Isige
FXStreet
John Isige is a seasoned cryptocurrency journalist and markets analyst committed to delivering high-quality, actionable insights tailored to traders, investors, and crypto enthusiasts. He enjoys deep dives into emerging Web3 tren




