How likely is Ethereum price to surge to $4,000 after the recent crash
- Ethereum price is retesting the support confluence, ranging from $3,000 to $2,800.
- A breakdown of this barrier could lead to a steep correction to $2,000.
- Short-term on-chain metrics suggest that a further move to the south is possible.

Ethereum price has arrived at a vital support level after crashing for the past week. This downswing puts ETH at a make or break point, indicating that things could go either way. However, if the big crypto continues to stumble, the smart contract token will likely follow suit.
Also read: Dow Jones futures bounce on in line US CPI data
The Merge and the first test
Ethereum developers have been promising massive upgrades to the network to take it from Proof-of-Work (PoW) to Proof-of-Stake (Pos). However, not all the updates have been timely. After countless delays, ETH is finally one step closer to the much-awaited Merge thanks to the recent test by some developers.
Although the launch date for Merge has not been officially announced yet, it is supposed to bring major ramifications to the network, ranging from improved security, higher transaction count, and reduced impact on the environment among others.
This test was conducted on a shadow fork to prevent an impact on the main chain. Parithosh, a developer related to the matter tweeted,
The merge pandas have arrived! mainnet-shadow-fork-1 hit TTD ~half an hour ago. We've been finalizing and producing blocks! We quickly noticed some seemingly minor issues with Nethermind and Besu(triage ongoing). Erigon is currently syncing to head, status update later.
Arthur Hayes, the ex-CEO and founder of BitMEX stated in his blog that post-Merge, institutional investors could flock to ETH since it would serve as a de facto bond with a higher yield than Treasury bonds.
In the same blog, Hayes also predicted the possibility of Ethereum price hitting $10,000 by the end of 2022.
Ethereum price from an optimist’s standpoint
Ethereum price has crashed roughly 17% after getting rejected at the 200-day Simple Moving Average (SMA) at $3,491. This move comes after multiple rejections since January 13 and is a significant development that has pushed it below the volume profile’s high volume node at $3,136.
However, this downswing has pushed ETH toward the immediate support confluence at roughly $3,000, consisting of the $2,820 to $2,966 demand zone, the 50-day and 100-day SMAs. Therefore, investors can expect a bounce off this level to kick-start another run-up.
The resulting rally needs to pass through the high volume node at $3,136 and grapple with the 200-day SMA at $3,491. In some cases, this move could pierce higher to fill the low volume node extending up to $3,703.
Only in a highly bullish scenario will Ethereum price retest the $4,000 psychological level.
ETH and its worse-case scenario
While the above outlook takes an optimist’s approach, a dire case scenario includes a breakdown of the support confluence, extending from $3,000 to $2,800. A decisive move below this area will confirm a bearish breakout and open the path for bears to take control.
In such a case, the Ethereum price will free fall to $2,541, which is a key support level that will prevent a further crash to $1,968. In a dire scenario, a sub-$2,000 level ETH could be a possibility, especially if the big crypto is also crashing.
Moreover, the volume profile also thins out considerably below $2,541, further adding credence to the downtrend scenario.
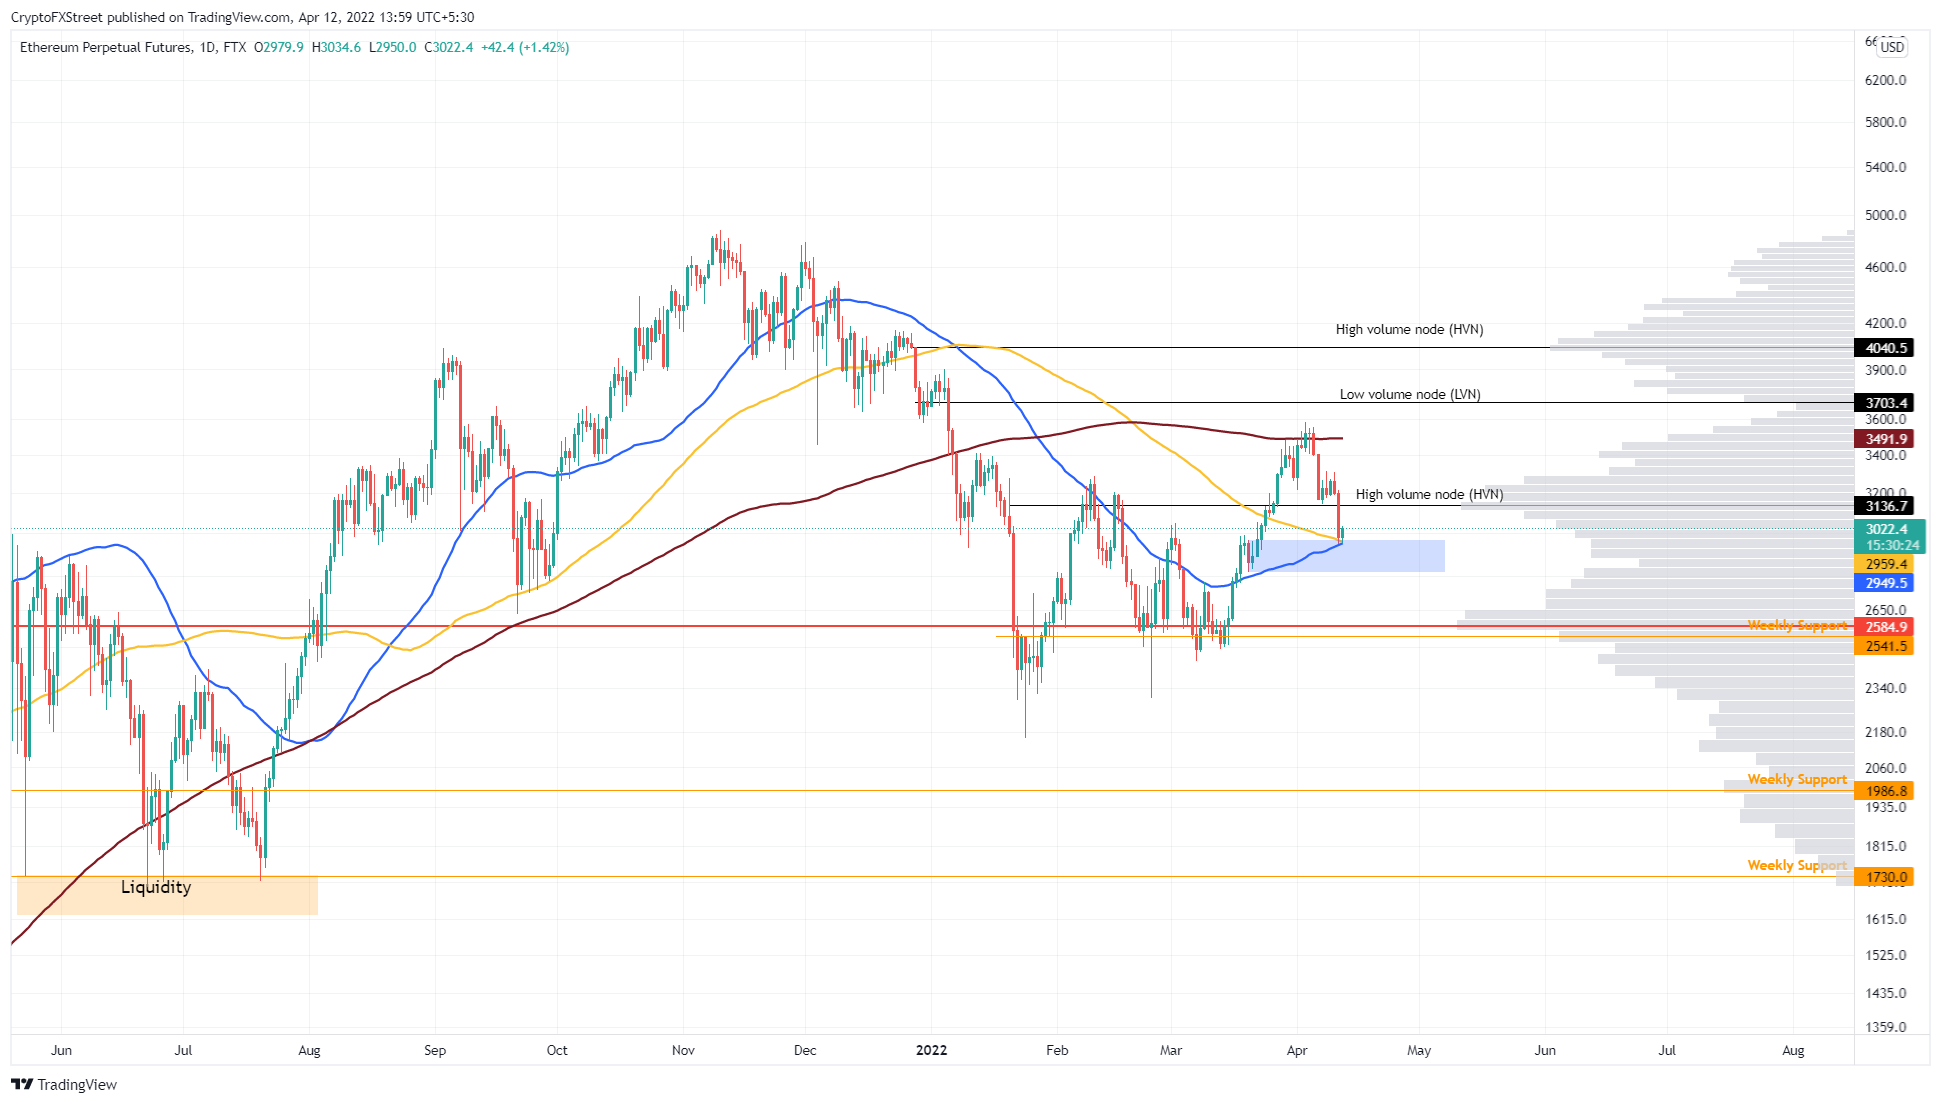
ETH/USDT 1-day chart
Supporting the forecast for a slow and steady uptrend for Ethereum price is a recent uptick in one-hour active addresses from 35,000 to 60,000. This sudden surge was seen on April 5 and comes after months of sideways movement.
The trend change indicates that investors are interacting with the ETH blockchain and are likely buying the dip after the recent crash.
While the rise in active addresses is no doubt bullish, the on-chain volume has been producing a lower high since April 2 and predicts that an uptrend might be delayed.
 [08.36.35, 12 Apr, 2022]-637853500533651121.png)
ETH active addresses vs on-chain volume
Supporting the bearish outlook is the 30-day Market Value to Realized Value (MVRV) model. This on-chain metric is used to determine the average profit/loss of investors that purchased ETH over the past month.
Currently, the index is hovering around -6% but as historical data shows, a local bottom is forming at around -10%, indicating that there is more room to the south.
 [08.42.22, 12 Apr, 2022]-637853500825133950.png)
ETH 30-day MVRV
Despite forces looking balanced for Ethereum price, the support confluence is a key determinant for the direction of the cryptocurrency in the near future. A breakdown could knock ETH to $2,541 and in some cases, $1,730. A bounce off the same support area could be key in triggering a run-up that shatters through the 200-day SMA at $3,491 and retests the $4,000 psychological level.
Author

Akash Girimath
FXStreet
Akash Girimath is a Mechanical Engineer interested in the chaos of the financial markets. Trying to make sense of this convoluted yet fascinating space, he switched his engineering job to become a crypto reporter and analyst.


