How Ethereum price can enter buy zone before exploding to $10,000
- Ethereum price has moved above the 200-day SMA, hinting at a bullish outlook.
- On-chain metrics for ETH are expressing extreme bullishness, adding credence to the technical scenario.
- Despite the overreaching optimism, there are two ‘buy-the-dip’ levels that investors need to keep a close eye on.
Ethereum price shows signs of moving higher after crossing above a crucial resistance barrier. On-chain metrics also reveal a bullish outlook, adding credence to the technical standpoint.
Ethereum price and conservative outlook
Ethereum price has finally moved above the 200-day Simple Moving Average (SMA) at $3,490 after multiple rejections since January 13. This move is a significant development that hints at a minor rally to the volume profile’s low volume node at $3,703.
Sidelined investors can wait for a retest of the 200-day SMA, which will likely result in a quick uptrend to $3,703. In some cases, this move could extend to the next high volume node at $4,040.
The above explanation is the most conservative outlook for ETH and assumes the Bitcoin price remains neutral or does not crash. However, a more interesting scenario would include retracements or steep corrections to important accumulation levels.
The most immediate level to buy the dip is the support confluence at roughly $3,000. Here, the $2,820 to $2,966 demand zone and the 50-day and 100-day SMAs coincide. Therefore, a bounce off this level would be the best-case scenario to kick-start a run-up to $4,000 or higher.
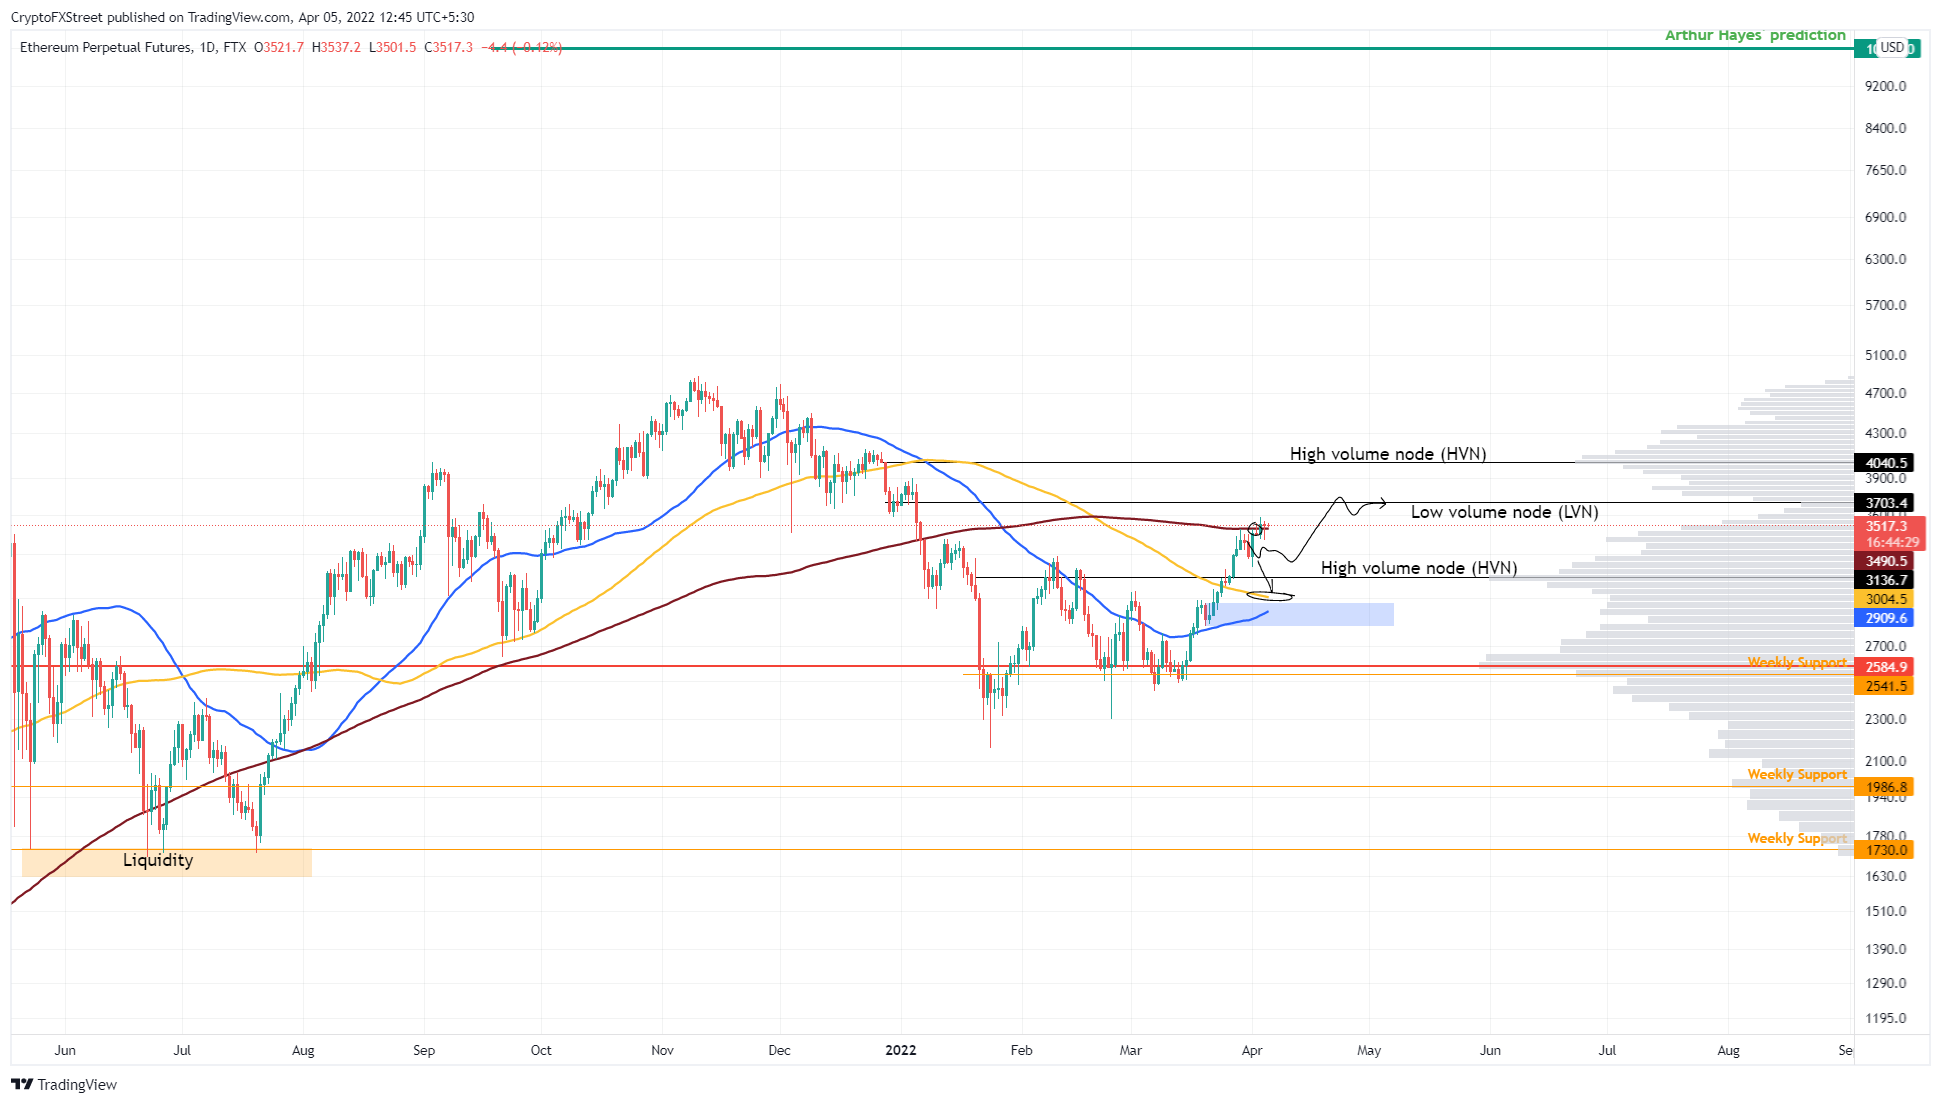
ETH/USDT 1-day chart
ETH and a more optimistic approach
This outlook explores the most bearish scenario before an exponential run-up to $10,000 and also offers the highest returns on investments. The alternative ‘buy the dip’ zone for Ethereum price is the $1,730 support level.
Perhaps, the most apparent reason for this is the uncollected liquidity resting below $1,730. This outlook will be possible if the Bitcoin price crashes to sub-$35,000, which would open the path for a further nosedive to $30,000.
Such a scenario would include moving below two psychological levels at $3,000 and $2,000. While bearish, a move from here to $4,000 would provide a return of more than 100%.
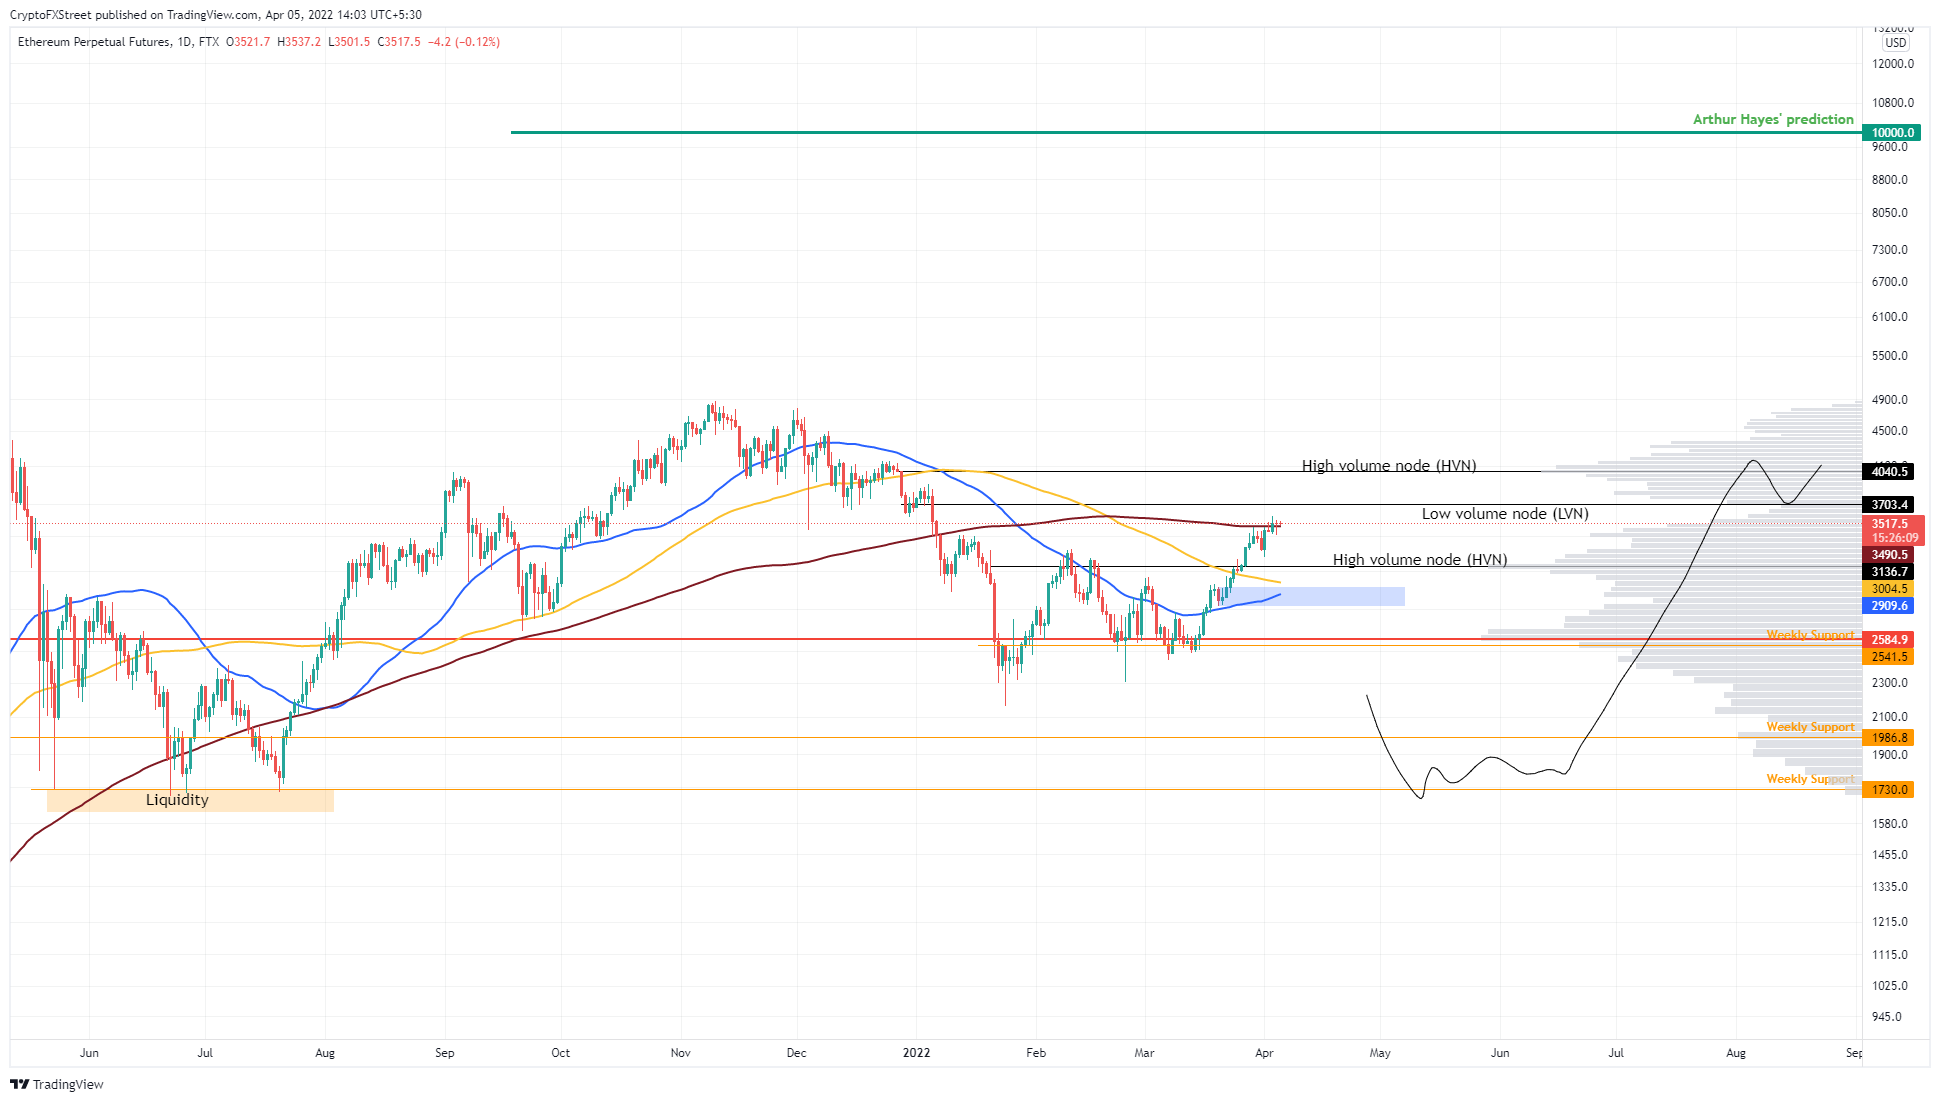
ETH/USDT 1-day chart
Factoring in the predictions of ex-BitMEX CEO Arthur Hayes, who believes Ethereum price will hit $10,000 by the end of 2022, reveals a colossal return.
In his blog on Medium, Hayes stated,
I have ridden the current ups and downs, and am very happy with the relative size of my ETH allocation within my crypto portfolio. The rest of 2022 is going to be the year of the ERC-20 angels led by his highness Vitalik. When the dust settles at year-end, I believe ETH will be trading north of $10,000.
Using the first buy zone, an investor’s theoretical return would be 233%, while the second and most bearish outlook would provide 400% gains.
On-chain metrics scream bullish
The net exchange position change tracks the in/outflows of ETH on centralized entities. Since March 14, ETH outflows have hit 1.32 million. In its seven-year history, such massive outflows have only taken place eight times, denoting the importance of this development.
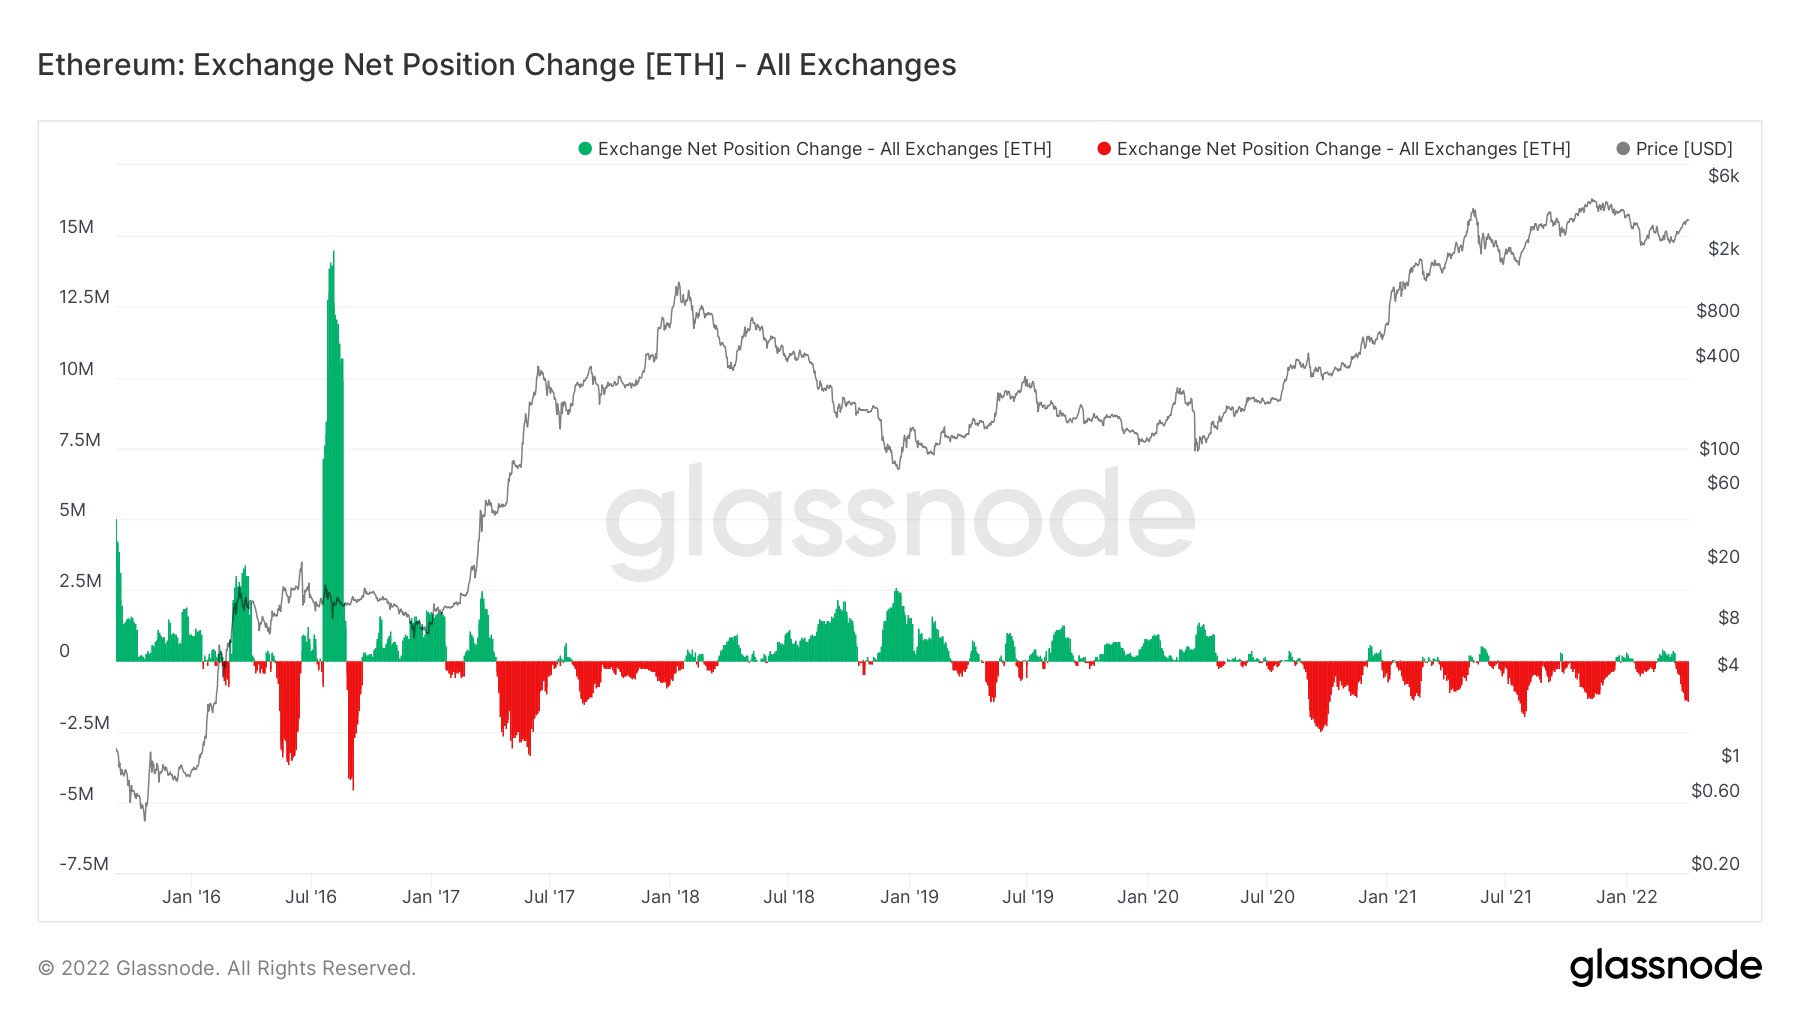
ETH net exchange position flow
Further adding credence to the bullish outlook for Ethereum price is the 365-day Market Value to Realized Value (MVRV). This on-chain metric is used to determine the average profit/loss of investors that purchased ETH over the past year.
Although the MVRV has flipped above the zero level, the local tops have formed around 38% and 72%, indicating that short-term investors are at breakeven and are unlikely to sell for a long time. This state of the MVRV indicator solidifies the bullish outlook outlined from a technical standpoint.
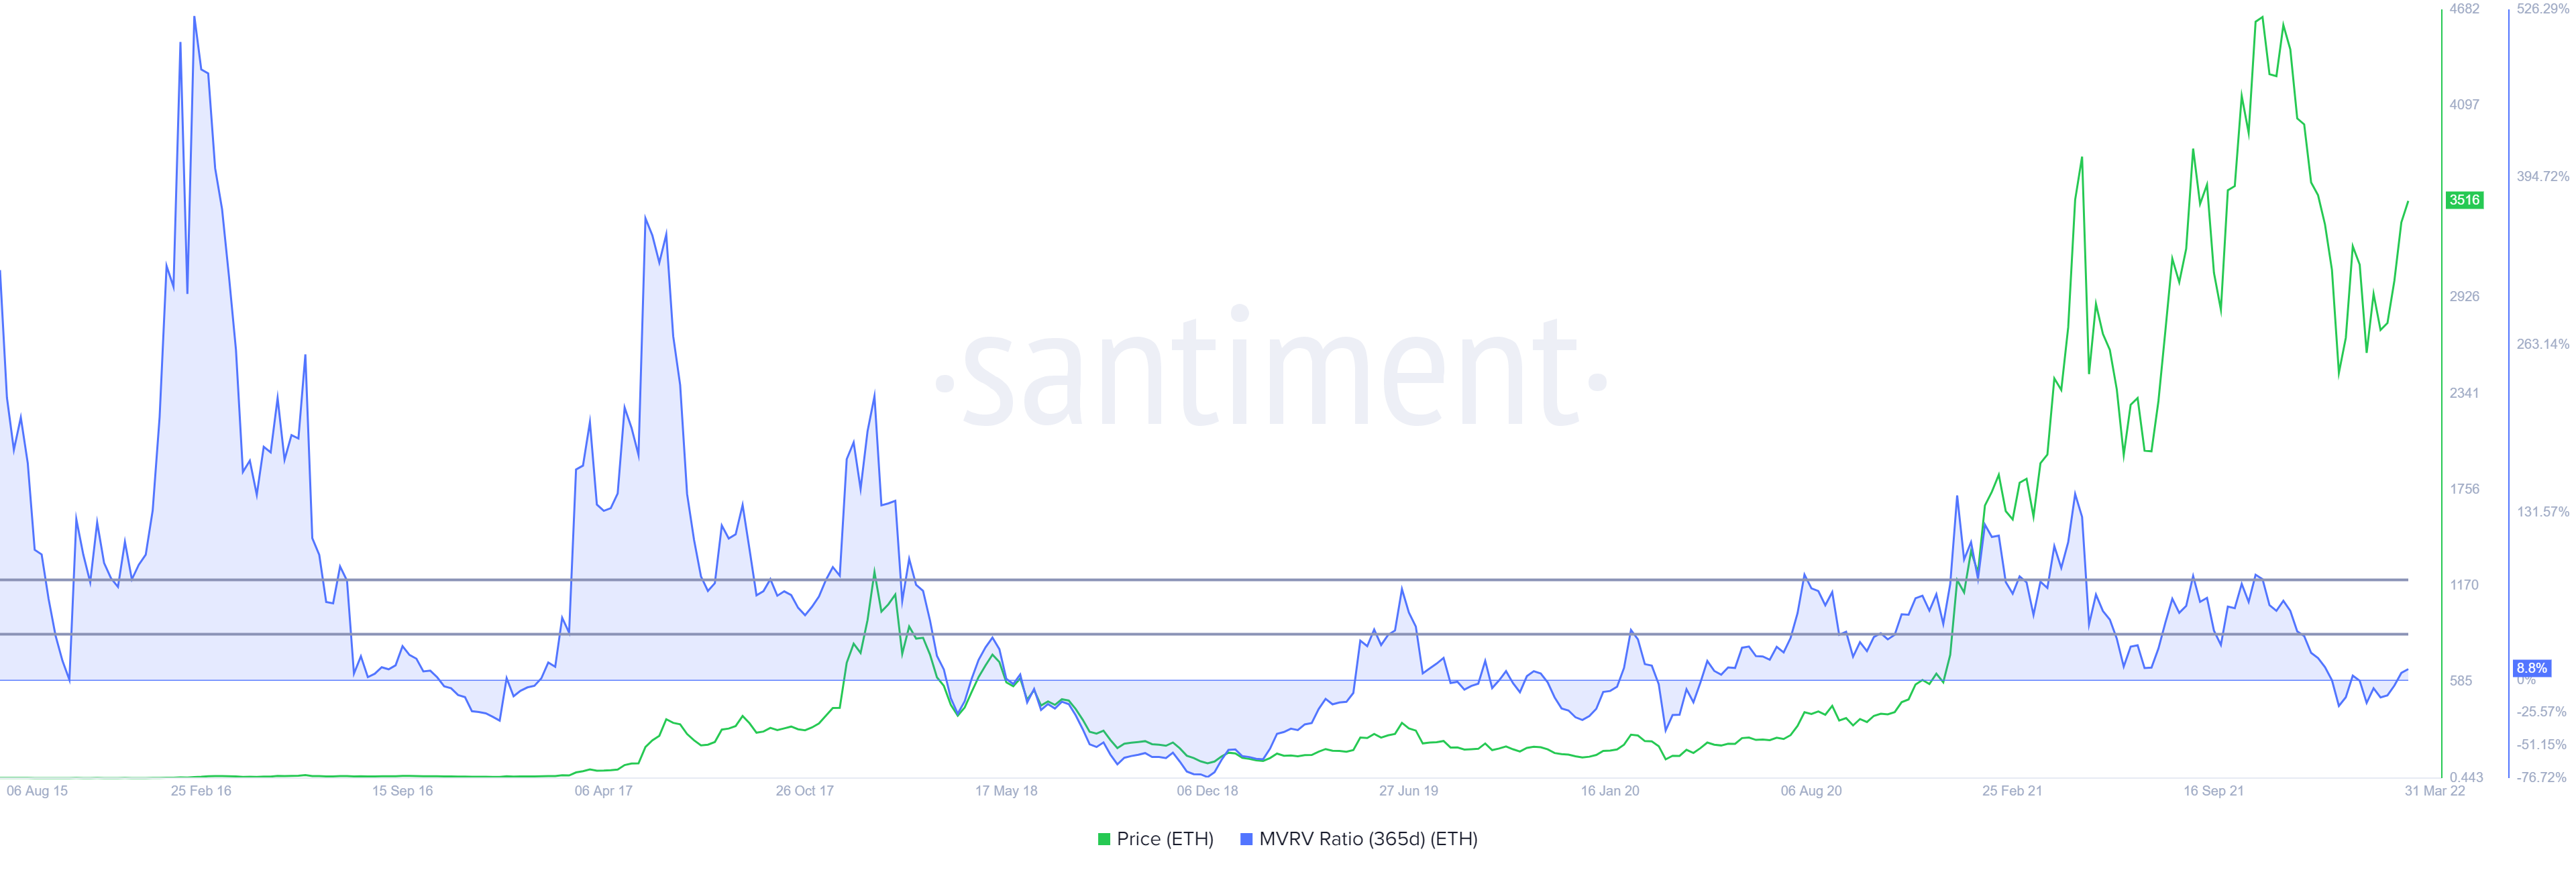
ETH 365-day MVRV
While things are looking up for Ethereum price, the first buy zone would face invalidation if ETH breaks below the $2,820 support level on a daily time frame. This development would further open the path for a more radical approach that expects the Ethereum price to crash to $1,730.
Author

Akash Girimath
FXStreet
Akash Girimath is a Mechanical Engineer interested in the chaos of the financial markets. Trying to make sense of this convoluted yet fascinating space, he switched his engineering job to become a crypto reporter and analyst.


