Here’s the ideal trade setup to catch the next surge for the Safemoon price
- SFM price is breaching through a triangle apex.
- Safemoon price is showing increased momentum on the Relative Strength Index.
- Invalidation of the bullish scenario is a breach below $0.0004035 after a successful retest of the triangle apex.

Safemoon price signals an upcoming price hike. The trade setup could produce very profitable returns if the technicals manifest.
Safemoon price scouting for a buy opportunity
Safemoon price displays subtle bullish cures reflected in the current price action. The Safemoon price attempts to breach through a previous degree wave four triangle. These tiny triangles usually produce very sharp retracements, which have been known to induce new bull rallies by trapping shorts sellers in the process.
Safemoon price also reflects a strong bullish optimism on the Relative Strength Index. The indicator displays the current price of $0.0005192, extending into overbought territories but with little resistance preventing a new rally. The ultimate trade setup will first be a breach through the triangle apex at $0.0006000. If the bulls can establish a rally, the price should continue rising higher. An ideal entry will be a retracement of the apex followed by bullish engulfing candles with decent volume on the 4-hour Chart.
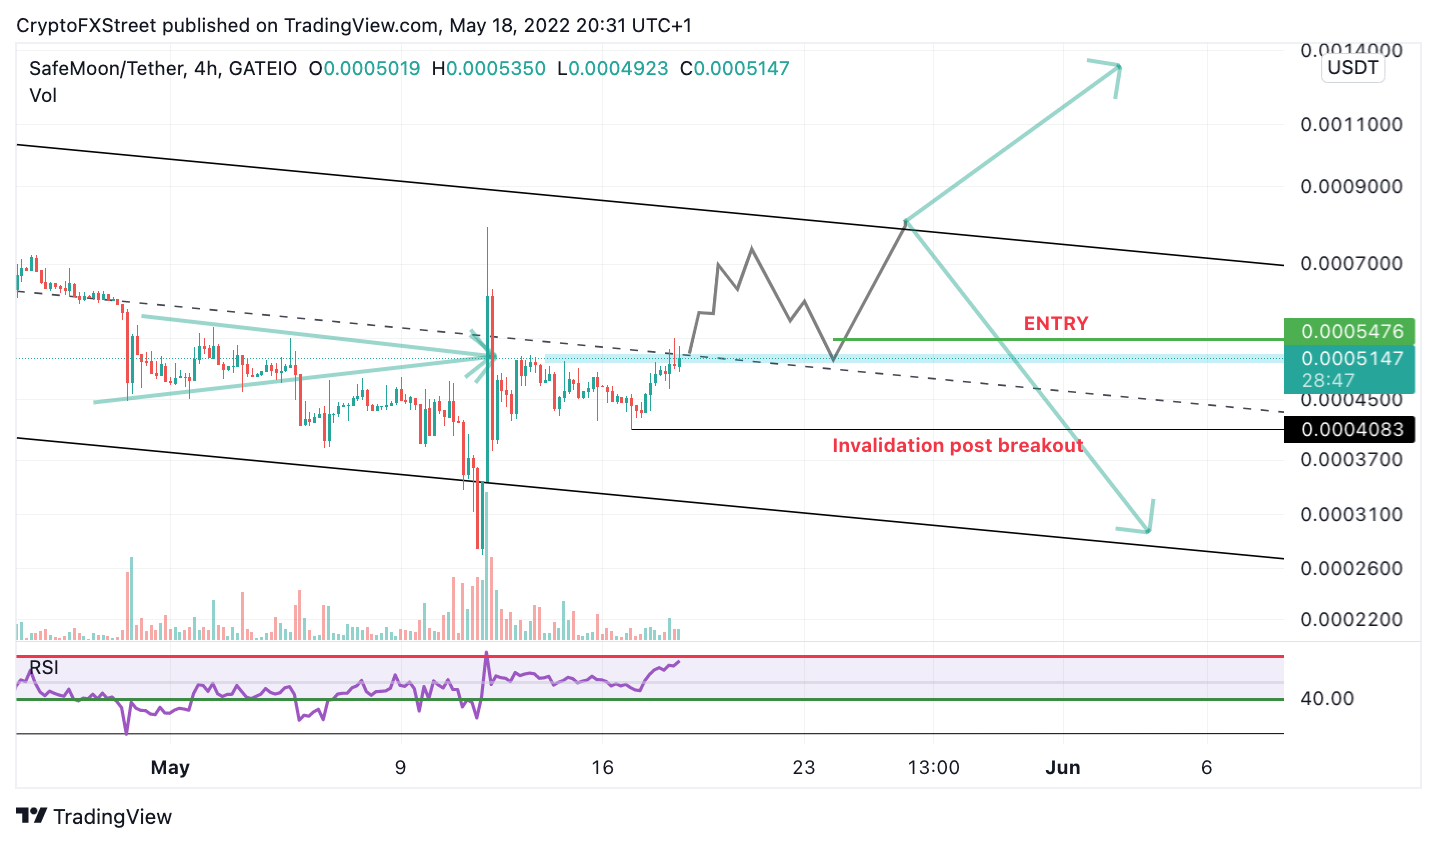
SFM/USDT 4-Hour Chart
Invalidation is vital for this setup. First, the bulls must break away from the apex and then retrace. On the second breakout from the retraced apex, traders can place a stop loss at $0.0004067 and aim for the trend line at $0.0007792. If the bears can breach the $0.0004067, consider this trade setup a failure. The bears could then aim for lower targets at $0.0002746, resulting in a 40% decrease from the current Safemoon price.
Author

Tony M.
FXStreet Contributor
Tony Montpeirous began investing in cryptocurrencies in 2017. His trading style incorporates Elliot Wave, Auction Market Theory, Fibonacci and price action as the cornerstone of his technical analysis.




