Here are some key insights into the Dogecoin speculative mania

Since its early days, crypto markets have gone through various speculative cycles. From Bitcoin to ICOs to meme tokens, traders have rushed in and out of multiple assets as the market and its participants evolve.
The most recent frenzy has arise in meme coins such as Dogecoin, and more recently in “safe” tokens such as SafeMoon, SafeMars and others. Many of these have returned over 1,000% but also crashed over 50% within a short period of time.
Dogecoin faces massive resistance ahead
The poster boy for meme tokens, Dogecoin has surpassed some of the wildest expectations. More than just Elon Musk, now the Dallas Mavericks and Slim Jim have moved to endorse the cryptocurrency. This, along with countless memes, propelled Dogecoin to go from $0.0055 to over $0.40 in 2021, or a 72x return year-to-date.
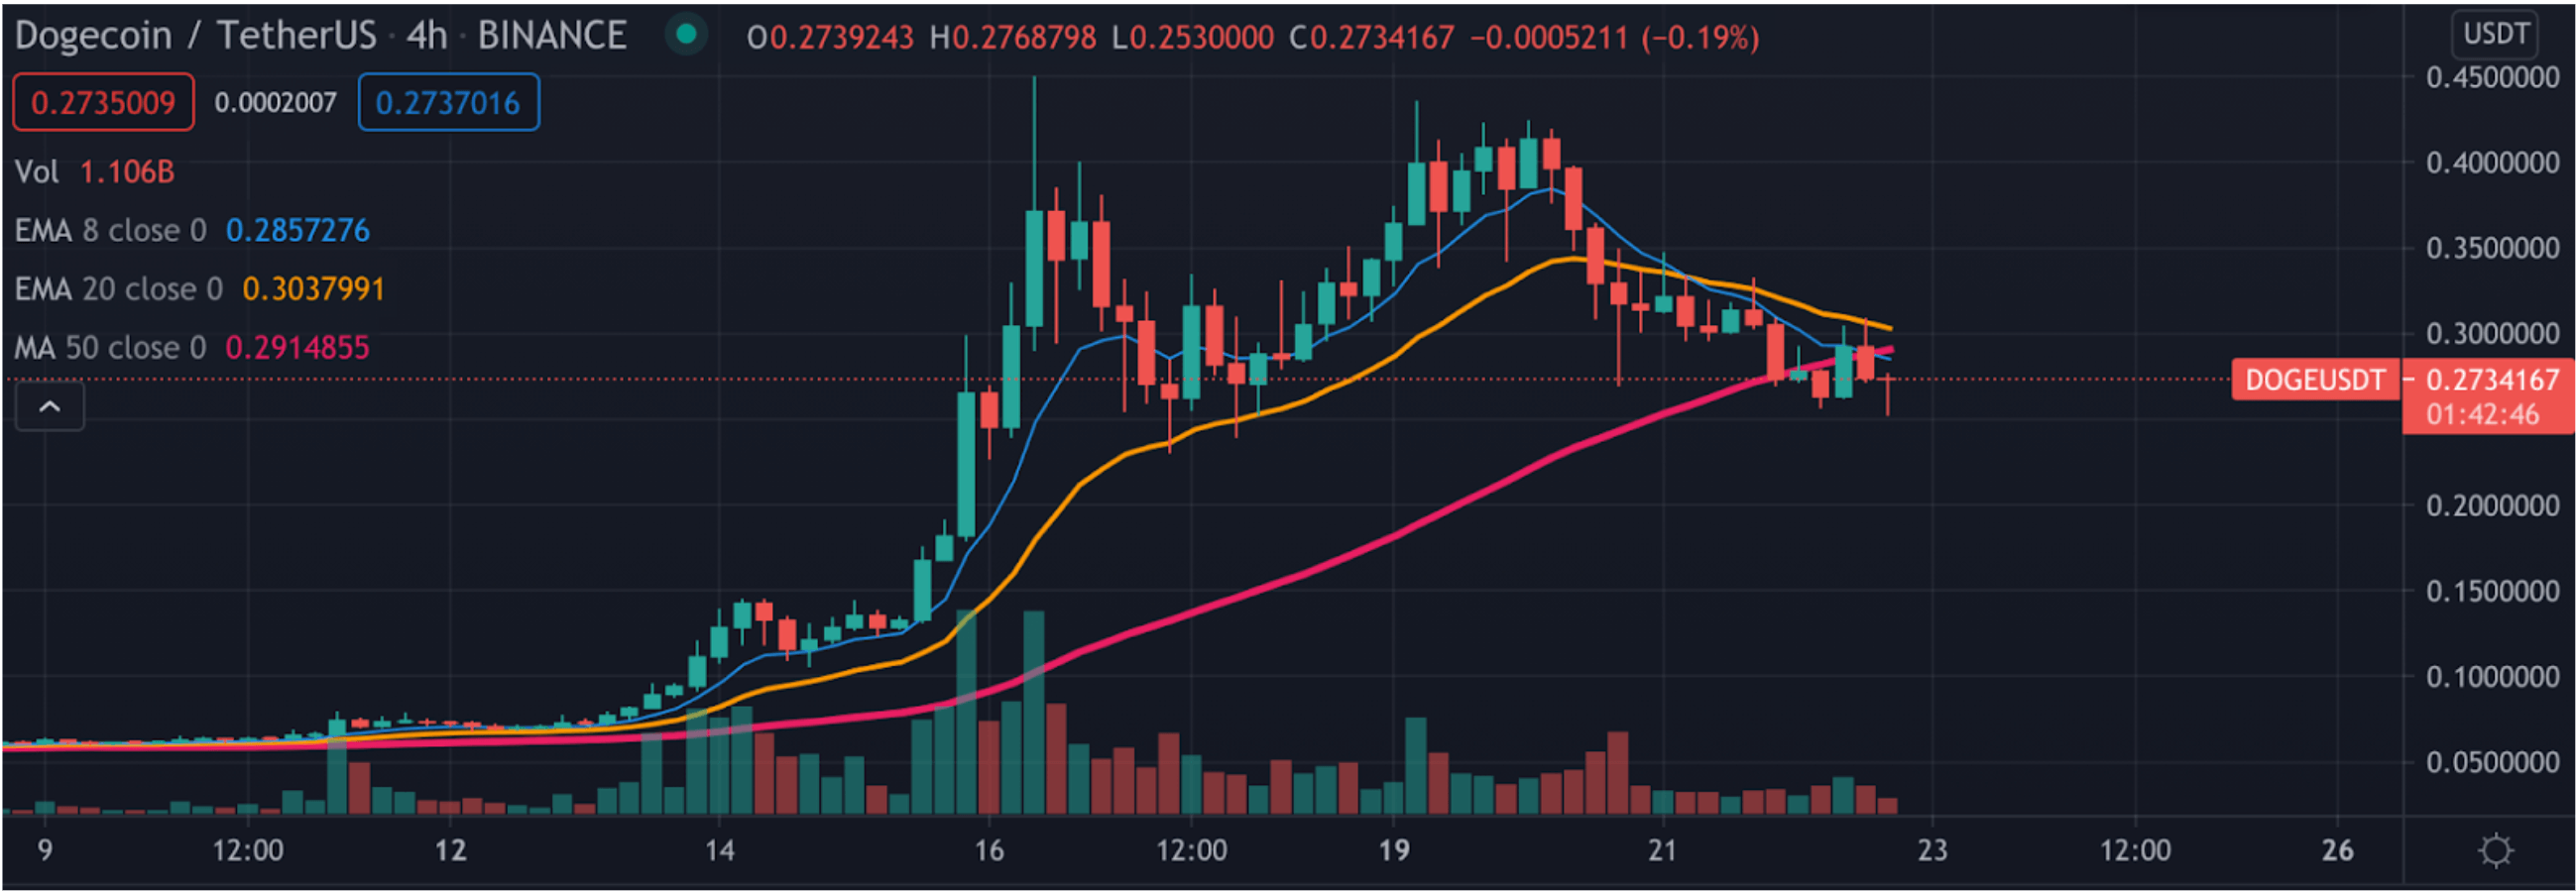
DOGE/USDt 4-hour chart
A lot of this mania has been driven through social media, primarily through TikTok. Countless videos have surfaced promoting how some have allegedly made millions off of this recent mania. A twitter page compiling these videos hass reached over 100 thousand followers within less than a year.
The excessive amount of speculation can also be noticed on-chain. The number of addresses holding DOGE for under a month reached a new high in April.
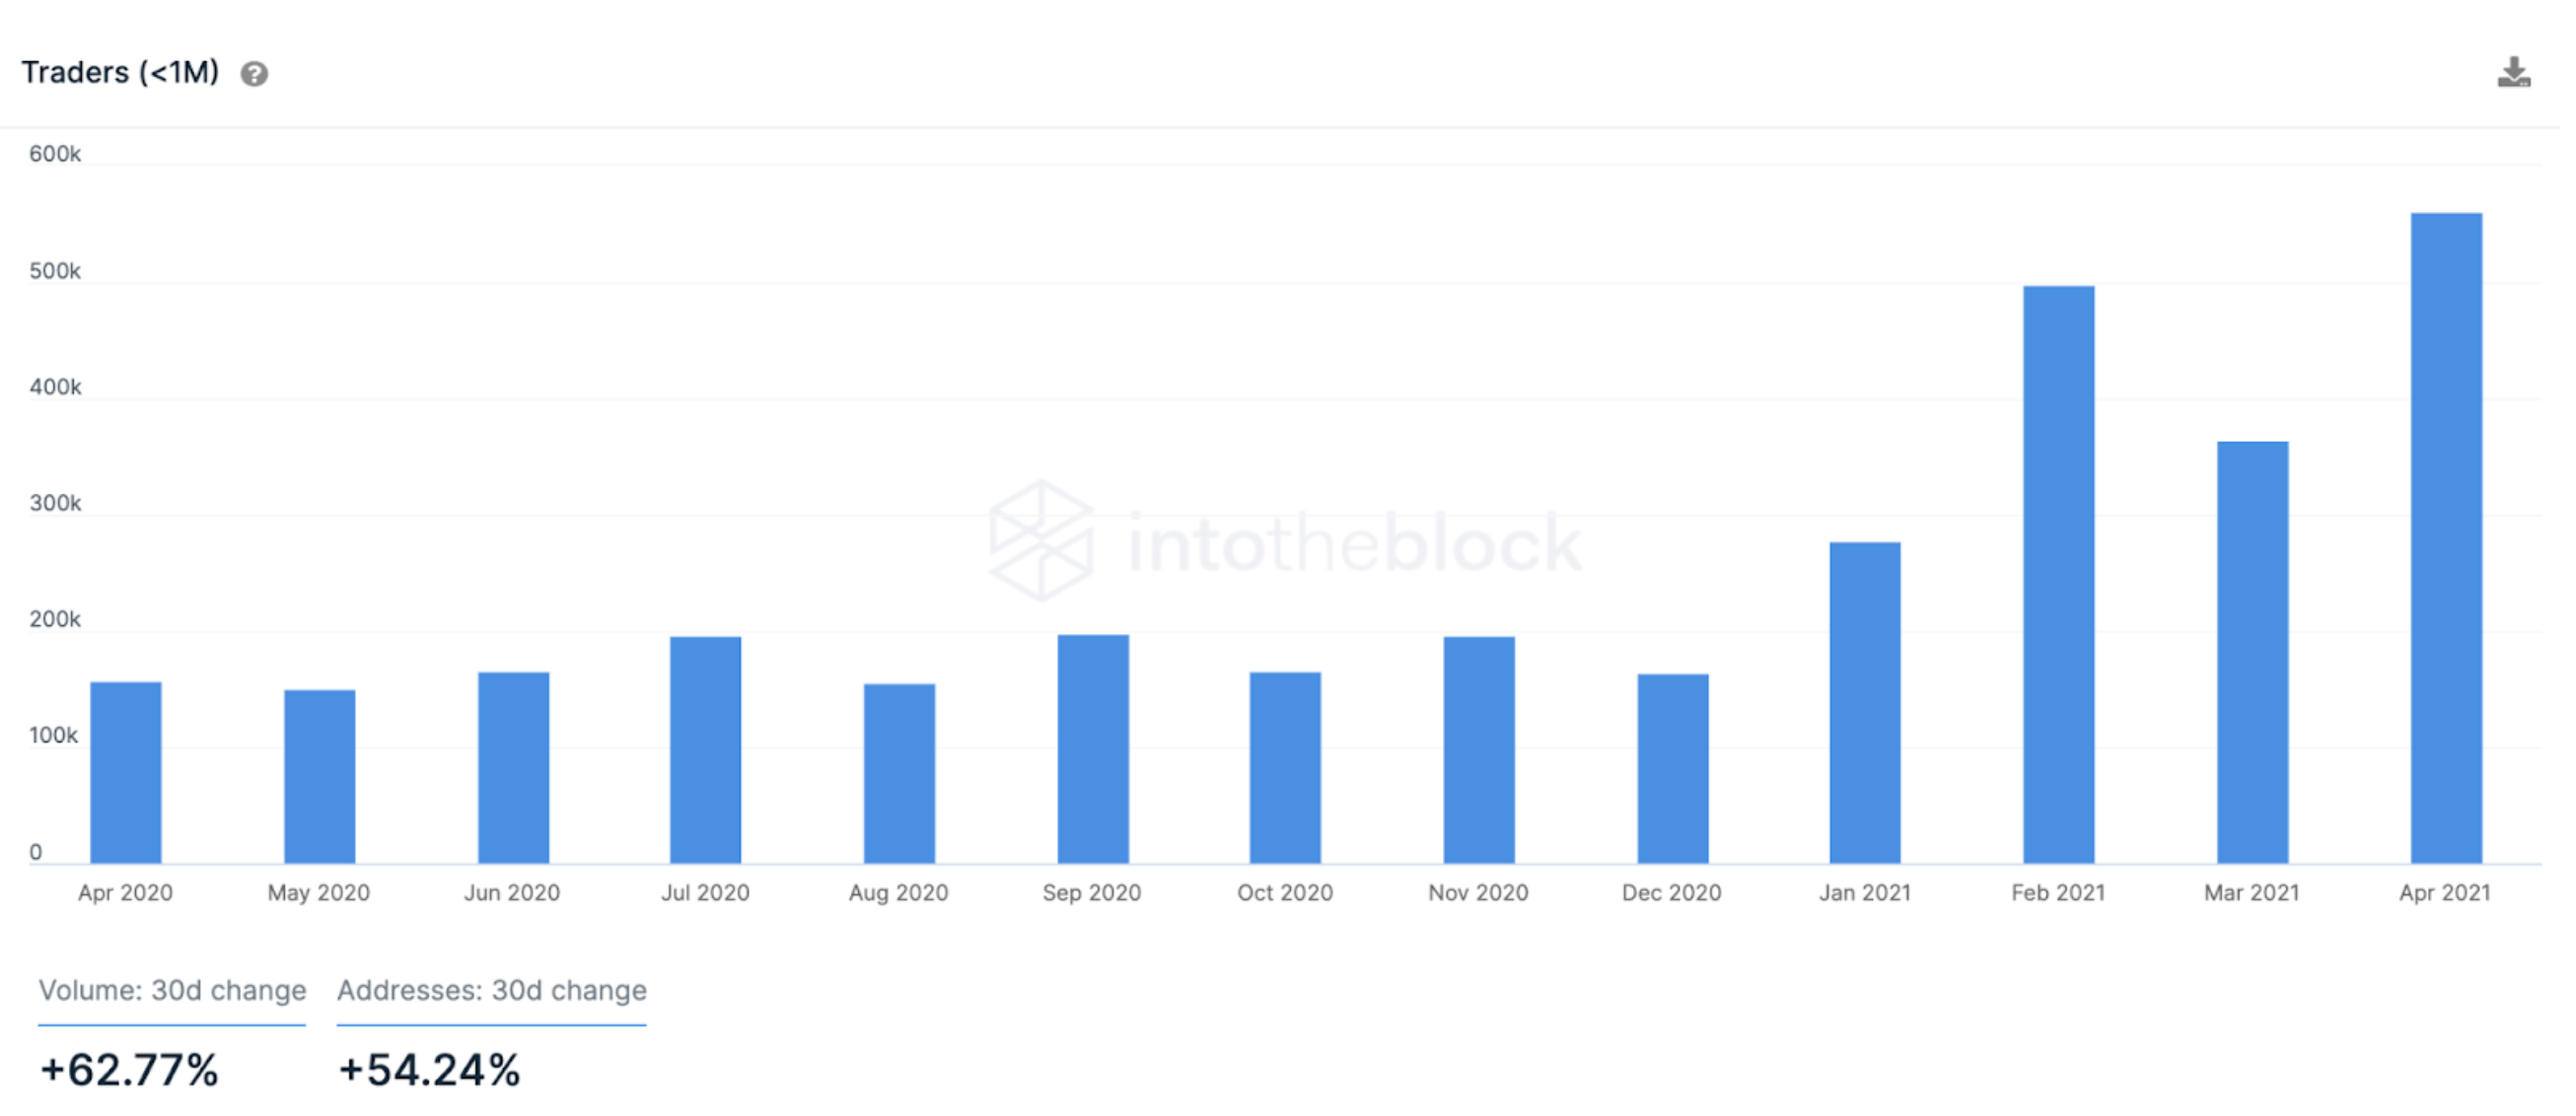
As of Apr. 22 through IntoTheBlock’s Dogecoin ownership indicators
The graph above shows that over a half a million addresses got DOGE within the past 30 days. While this certainly is a massive number by any means, the number of people who have bought DOGE in April is expected to be even higher considering that entities like Robinhood manage multiple users funds within a select number of wallets.
In terms of support and resistance, IntoTheBlock’s In/Out of the Money Around Price (IOMAP) points to low support and high resistance near the price at the time of writing.
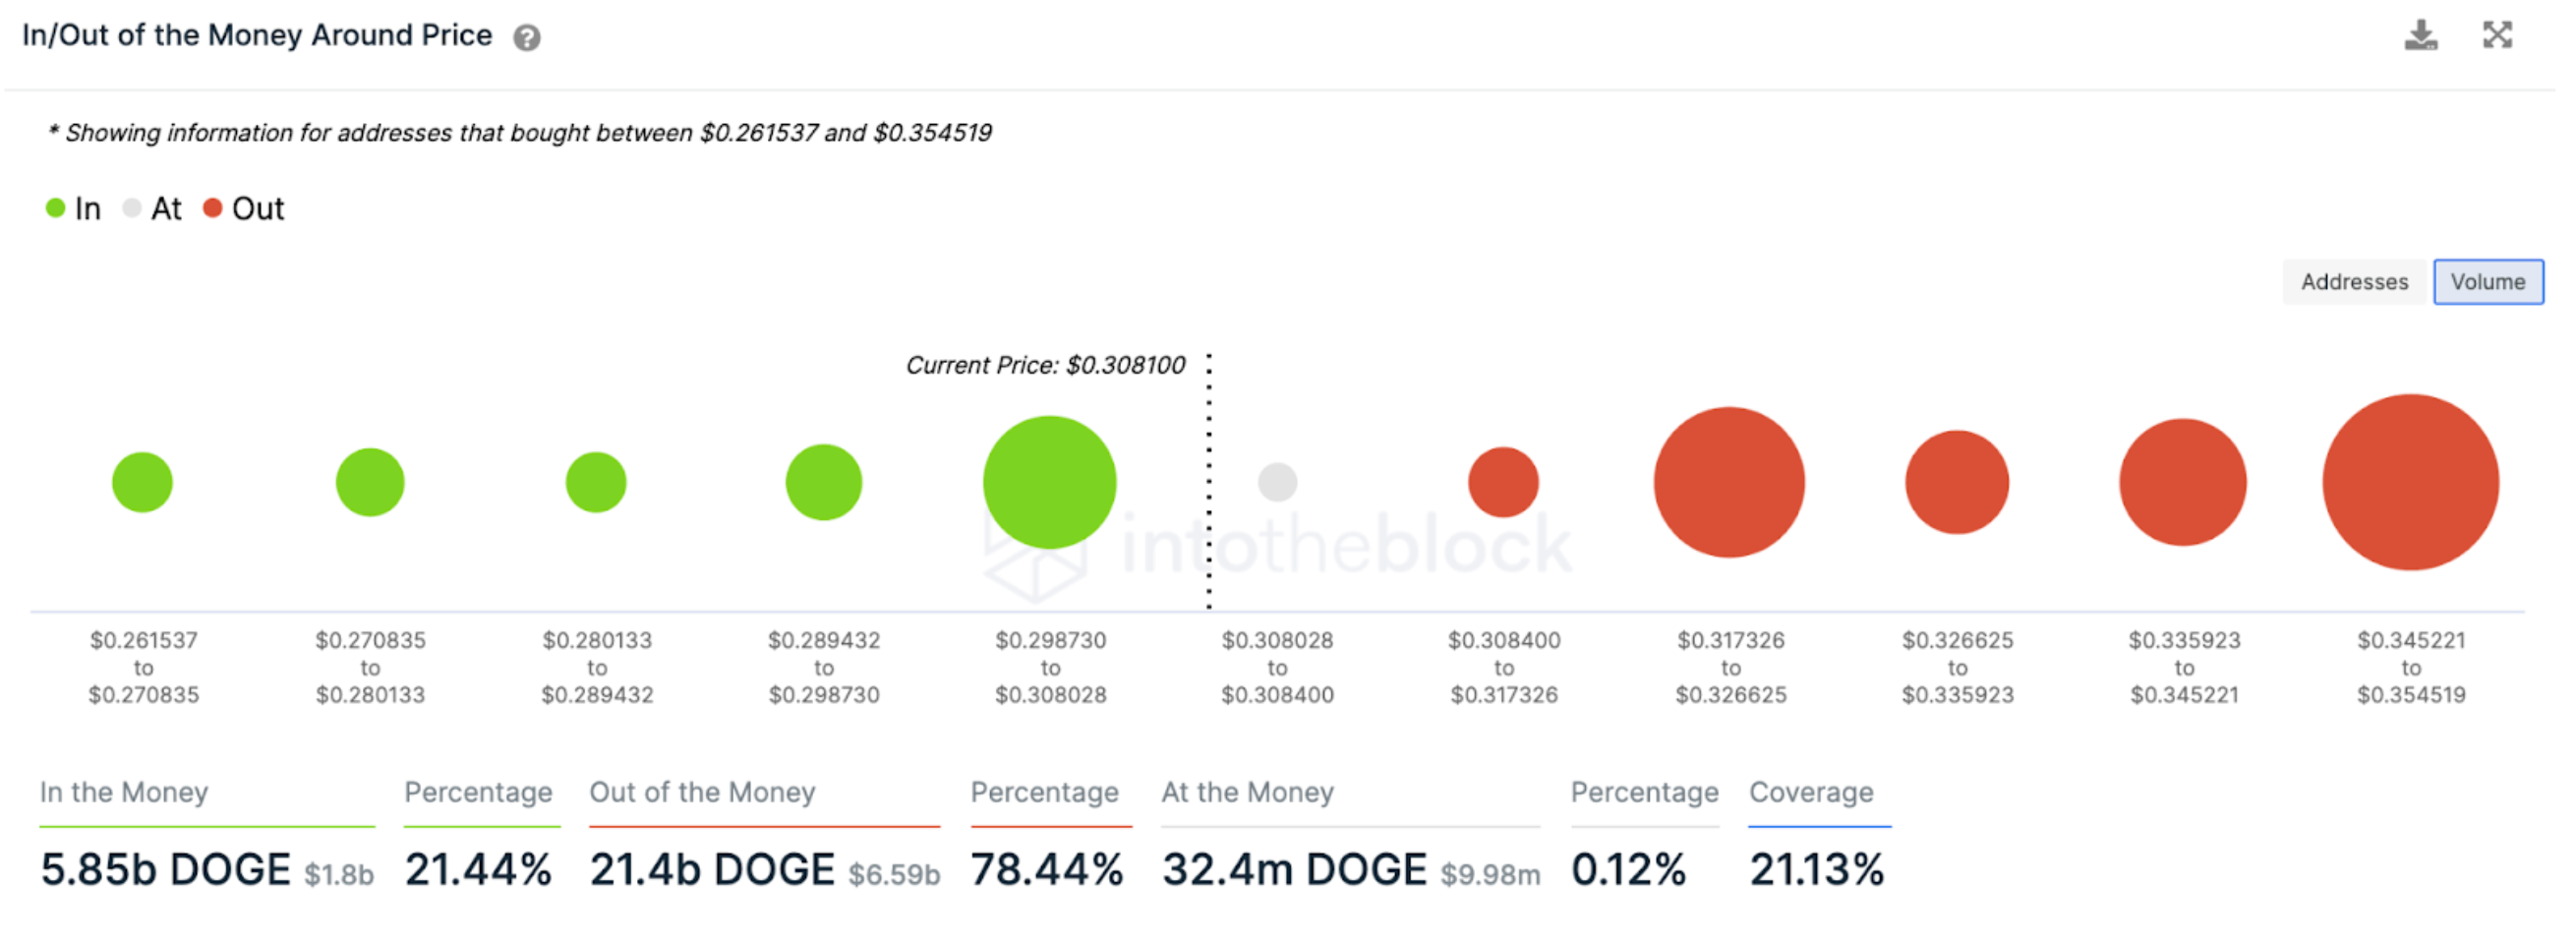
As of Apr. 21 through IntoTheBlock’s Dogecoin financial indicators
There is a large cluster of addresses that previously bought millions of DOGE around $0.30 that should act as near-term support. If that were to break, though, there is little support avoiding prices to cascade lower.
There is significantly higher resistance, coming from 78.44% of DOGE bought within 30% of the current price being out of the money, or losing money on their positions. Particularly around $0.32, high resistance is expected. The high amount of addresses losing money could also potentially lead to panic selling following the recent sudden price rise.
Dogecoin has crashed 40% since its recent high. While these indicators may not guarantee that a high was recorded, it does shed light on the worryingly high amount of speculation taking place. With billions of dollars worth of liquidations, the market appears to be shifting to a more cautious stance as evidenced by the neutral funding rates. Ultimately, it is very difficult to time the top with speculative waves such as the ones seen with meme tokens recently, but it is important to keep in mind associated risks in circumstances like these.
Author

FXStreet Team
FXStreet
Composed of a group of economic journalists and FX experts, the FXStreet content team produces and oversees all content published on FXStreet. It provides a purely journalistic approach to the Forex market.



