Fartcoin, Jupiter, Pump.fun lead the crypto market pullback as bullish momentum fades
- Fartcoin posts double-digit losses to test the 100-day EMA.
- Jupiter’s failure to hold above the 200-day EMA erases Sunday's gains.
- Pump.fun extends losses within a falling channel as bearish momentum prevails.

Fartcoin (FARTCOIN) edges lower after a nearly 14% drop on Monday, outpacing the broader market pullback in the last 24 hours. The meme coin holds above the 100-day Exponential Moving Average (EMA) as the rising bearish momentum risks a potential retest of the $1 psychological level.
Furthermore, Jupiter (JUP) and Pump.fun (PUMP) extend losses as bullish momentum fades, securing the silver and bronze places in the pullback.
FARTCOIN risks losing $1 as selling pressure increases
FARTCOIN edges lower at press time on Tuesday after nearly 14% losses on Monday, testing the 100-day EMA. The meme coin risks extending its losses as the Relative Strength Index (RSI) reads 42, dropping below the halfway line, which indicates a surge in selling pressure.
Investors must temper their reversal expectations as the Moving Average Convergence Divergence (MACD) indicator displays intense red histogram bars rising below the zero line, signaling increased bearish momentum.
The 61.8% Fibonacci level at the $1.00 psychological level, drawn from $2.74 on January 19 to $0.19 on March 10, acts as a crucial support for the meme coin. A decisive close below this level could extend the decline to the 200-day EMA at $0.95, followed by the 50% Fibonacci level at $0.73.
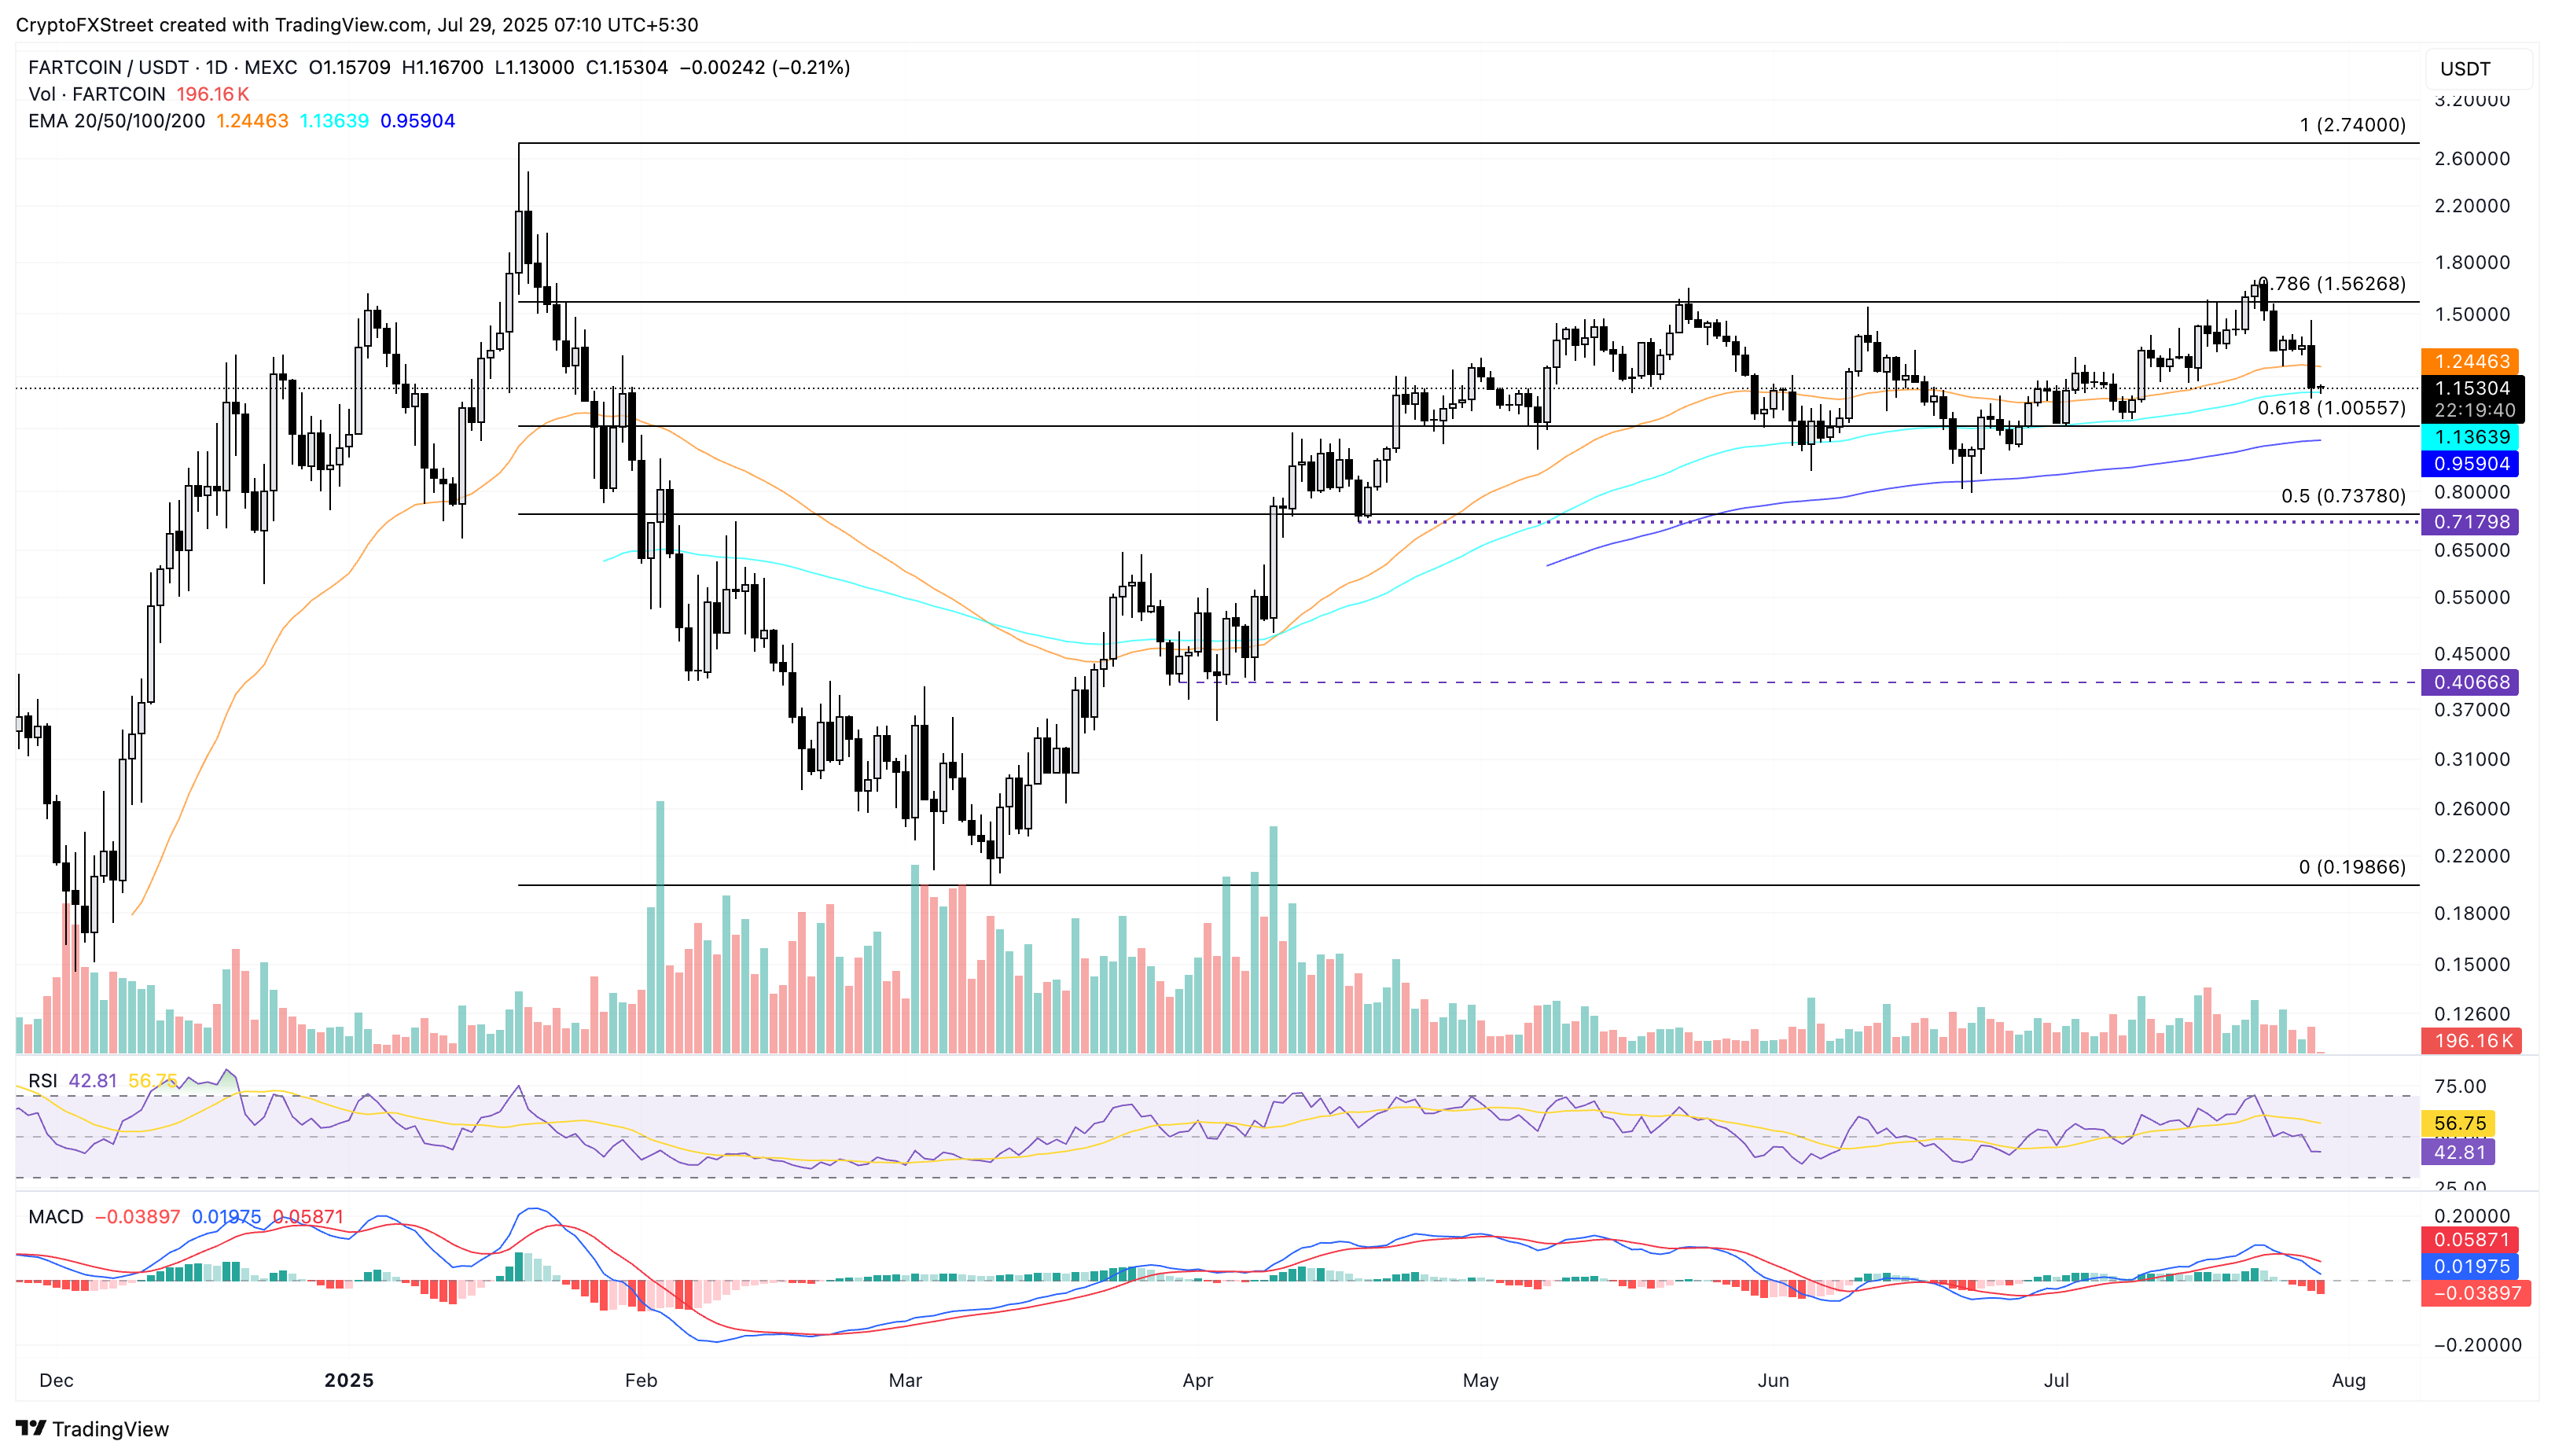
FARTCOIN/USDT daily price chart.
On the flip side, a bounce back could test the 50-day EMA at $1.24.
Jupiter targets a decline to the 100-day EMA
Jupiter’s JUP edges lower by nearly 1%, extending the losses after a 7% drop on Monday. JUP fails to overcome selling pressure above the 200-day EMA, resulting in a lower high formation after last week’s peak at $0.6339.
The path of least resistance guides the altcoin towards the 100-day EMA $0.5100.
The MACD crossed below its signal lines on Monday, marking a bearish shift in trend momentum. Still, the RSI at 52 holds above the halfway line, facing downwards, indicating a decline in buying pressure.
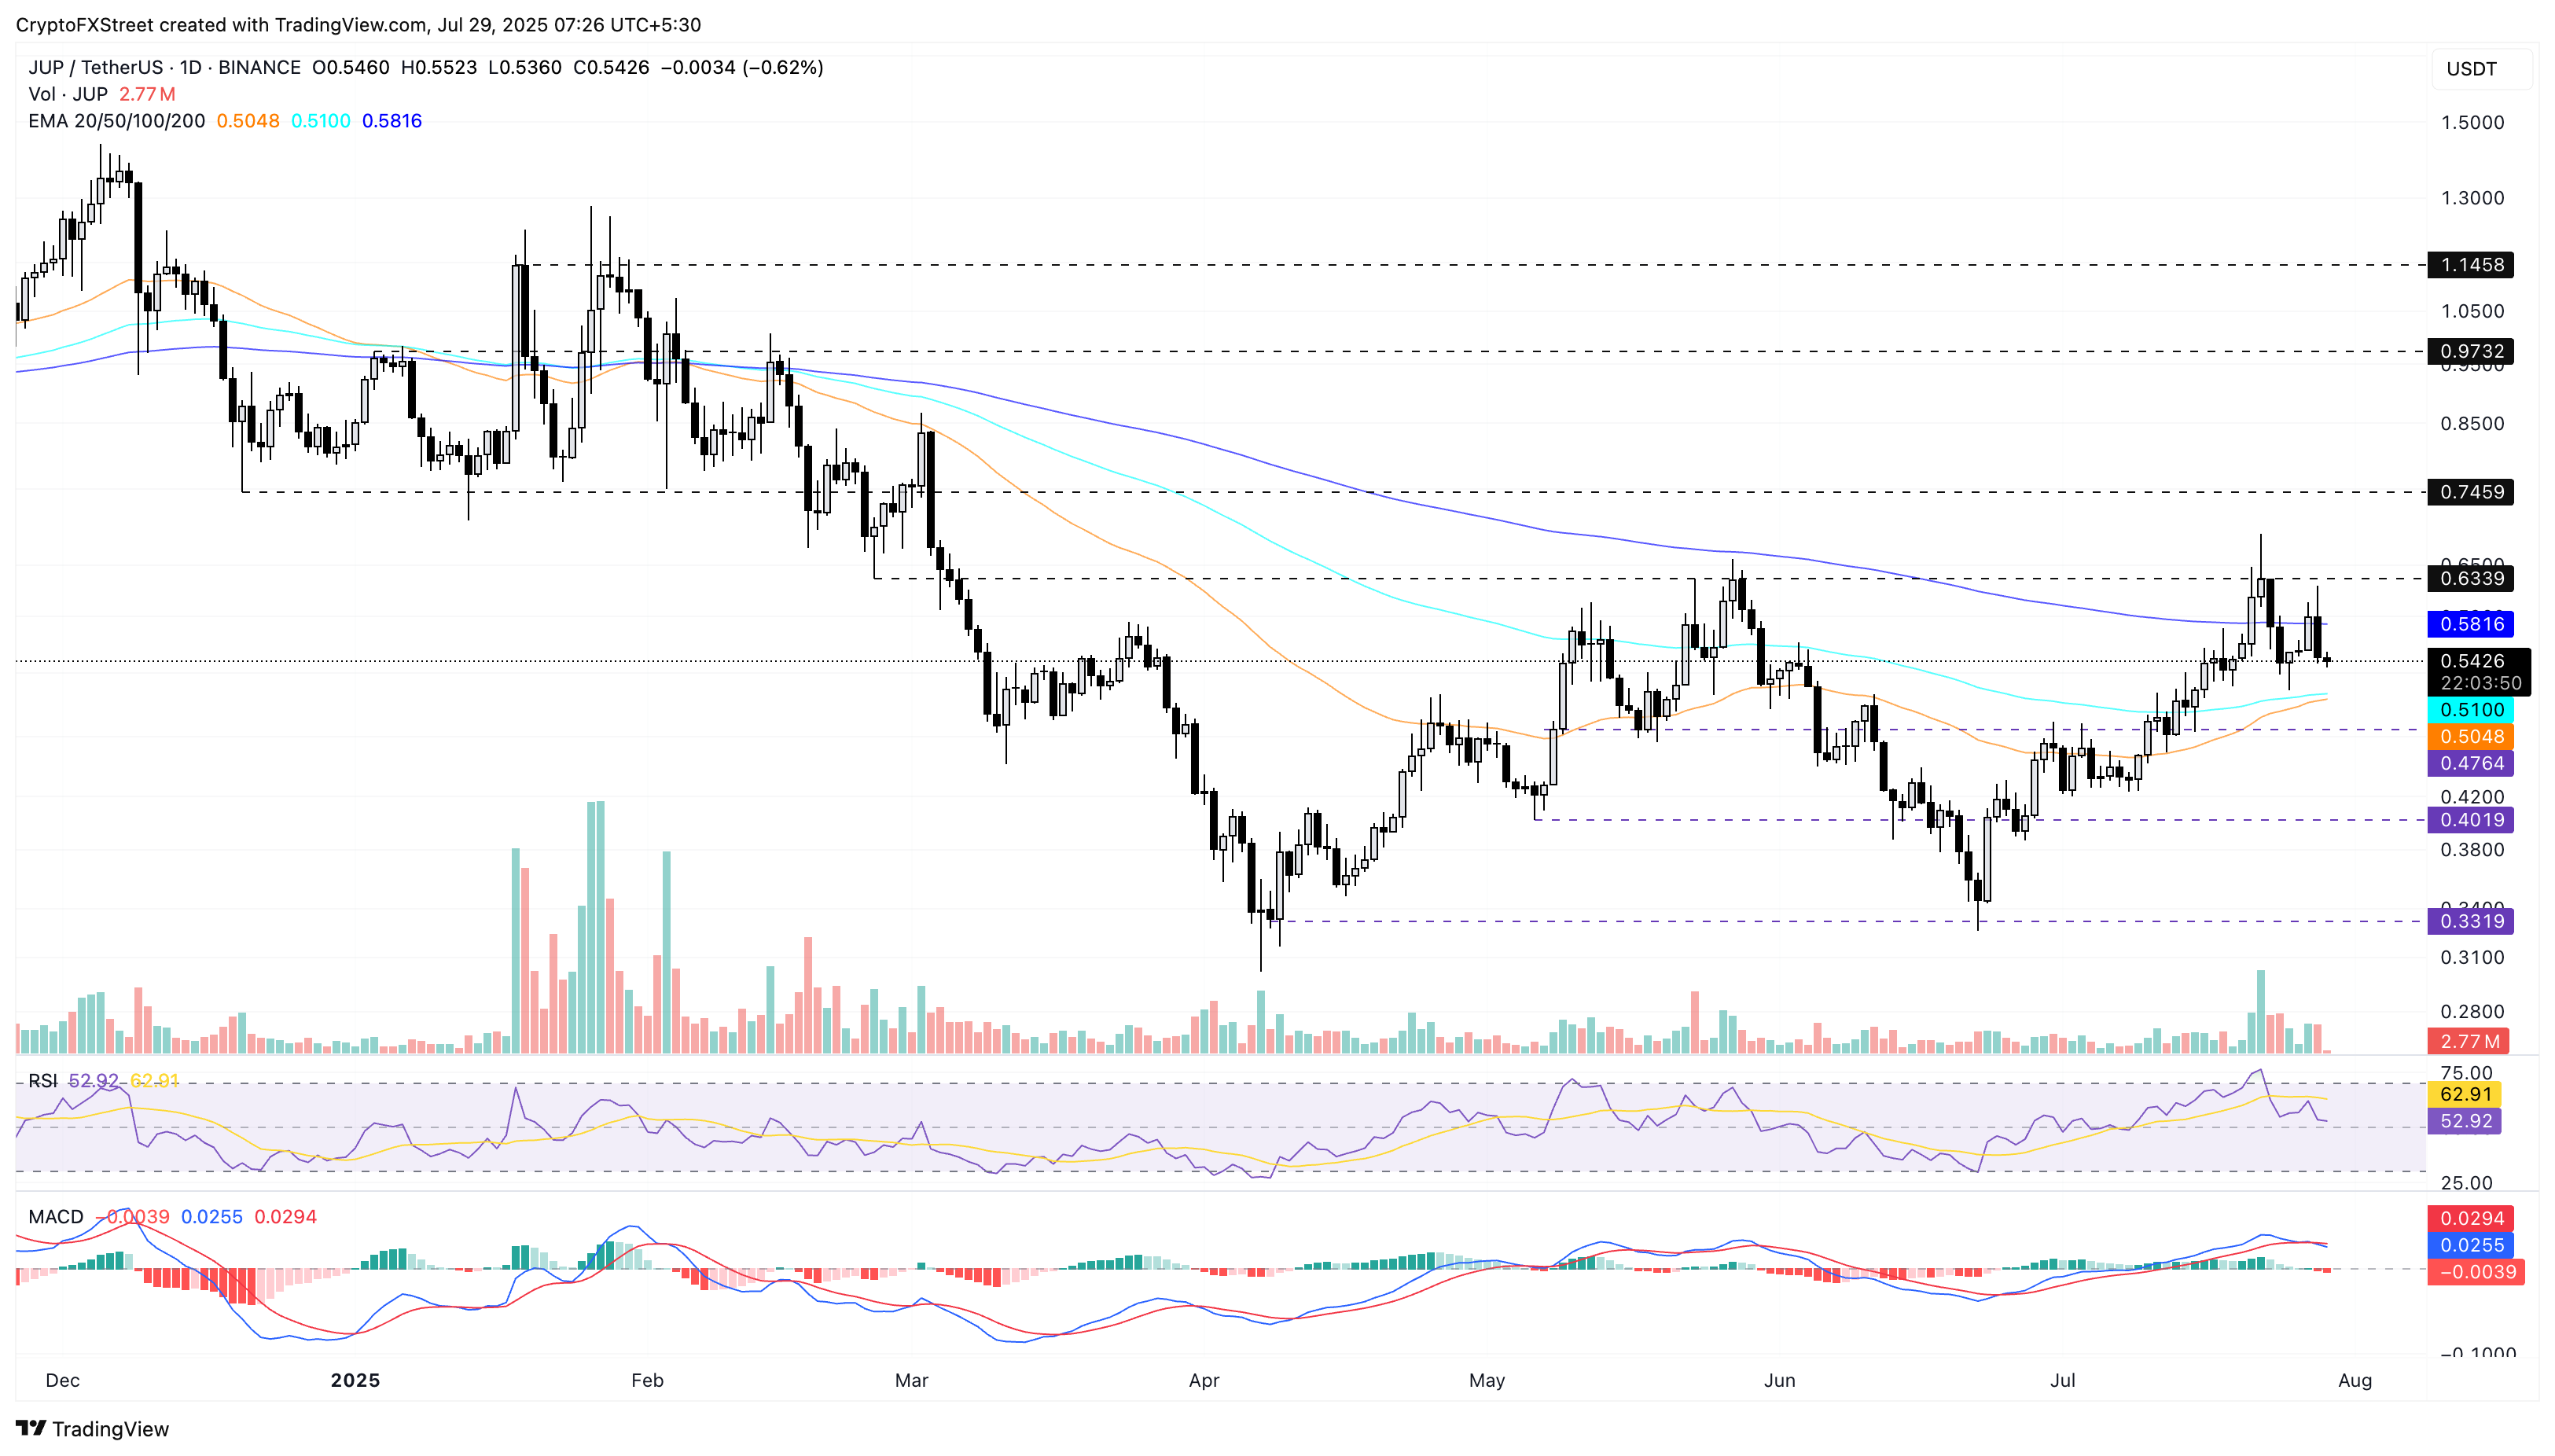
JUP/USDT daily price chart.
To reinforce an uptrend, JUP must reclaim the 200-day EMA and surpass the $0.6339 resistance level.
PUMP extends losses in a bearish pattern, targeting a psychological support level
PUMP continues to decline within a descending broadening wedge pattern formed by two diverging declining trendlines on the 4-hour chart below. At the time of writing, the meme token launchpad token is down nearly 2% on Tuesday, extending the losses for the third consecutive day.
PUMP approaches the $0.002300 level marked on Friday, as selling pressure grows, indicated by the RSI at 34, which is approaching the oversold boundary on the 4-hour chart.
Investors must pay attention to the MACD approaching its signal line, and a crossover would flash a sell signal.
A bearish close under $0.002300 could extend the decline to the $0.002000 psychological level, aligning with the S2 pivot level.
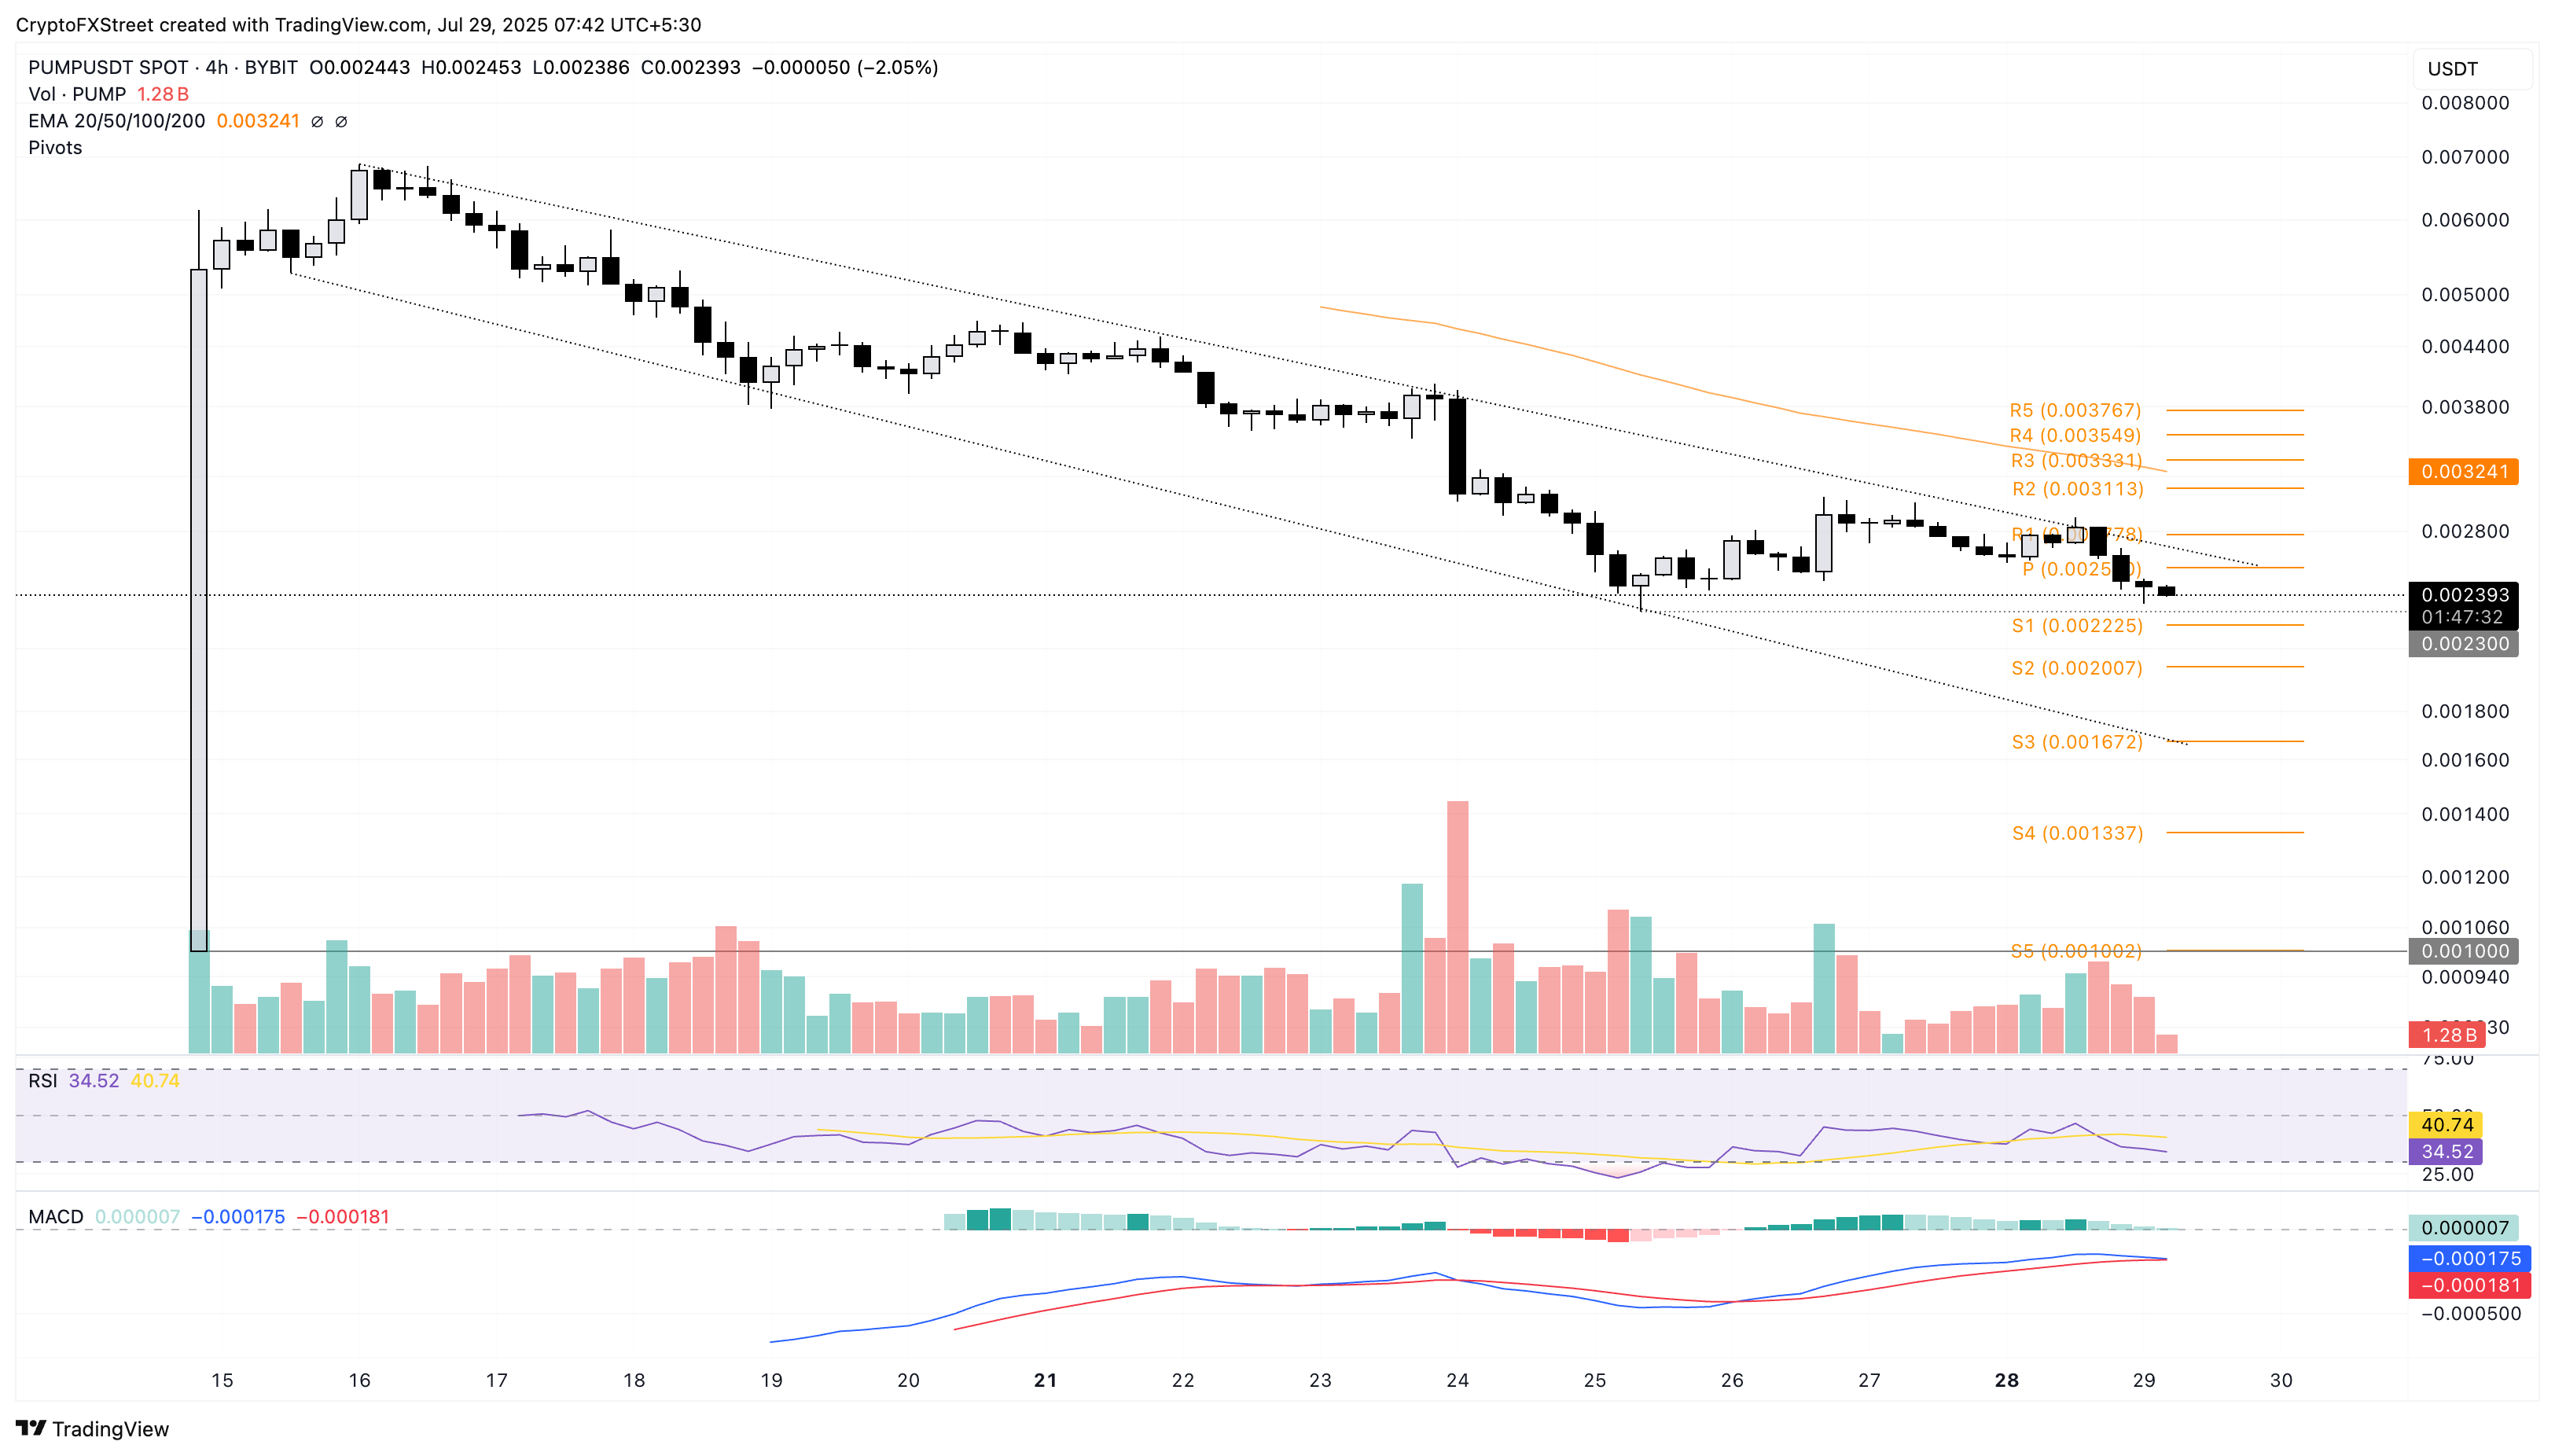
PUMP/USDT daily price chart.
On the flip side, a reversal in PUMP must surpass the overhead trendline at $0.002650 to invalidate the bearish trend. In such a case, the uptrend could target the $0.002800 level last tested on Friday.
Author

Vishal Dixit
FXStreet
Vishal Dixit holds a B.Sc. in Chemistry from Wilson College but found his true calling in the world of crypto.