Investors are wary of Ethereum's historical negative September returns, here's why
- Ethereum's negative average returns in September could see the top altcoin record another month of losses.
- US products spark another week of net outflows for Ethereum ETFs.
- Ethereum price needs to move outside a key rectangle to determine its next trend.

Ethereum (ETH) is up 2% on Monday despite negative sentiment around ETH's historical weak price action in September. Meanwhile, ETH ETFs continue their weak trend, recording another week of net outflows.
Daily digest market movers: Ethereum weak September returns, ETH ETF outflows
Several market participants are anticipating that Ethereum may see further declines in September due to its historical negative average return in the month. Since the ICO boom of 2017, ETH only recorded an average positive September return in 2019, per Coinglass data.
With an average and median return of -6.8% and -12.6%, respectively, investor sentiment going into the month is slightly negative. This also follows ETH ending August with an average loss of 22%.
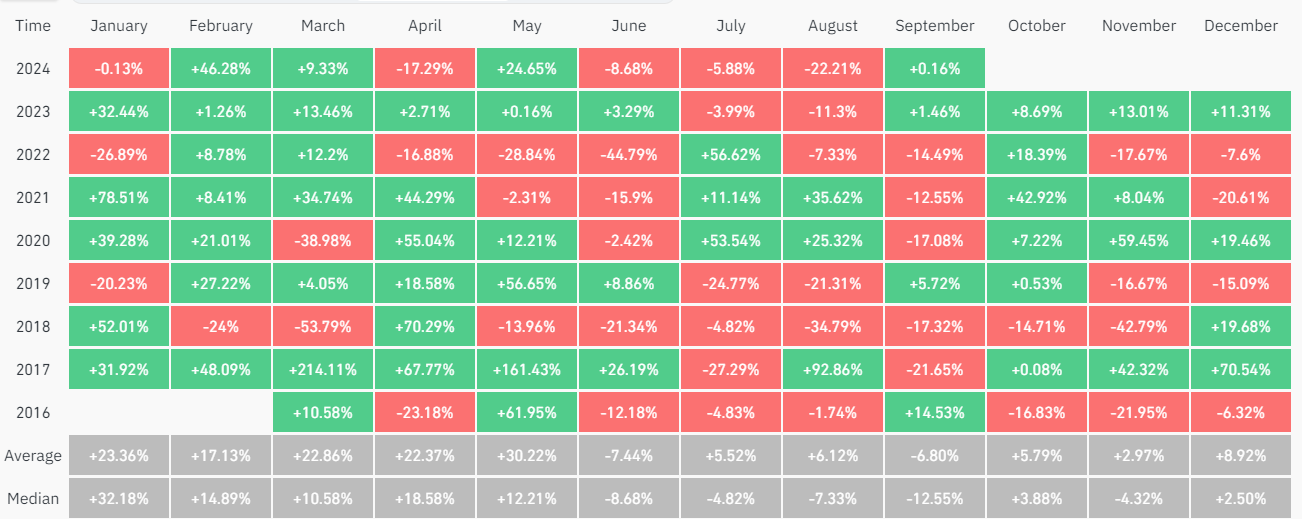
Ethereum Monthly Returns (%)
On the other hand, some investors are anticipating that a potential rate cut by the Federal Reserve (Fed) will help ETH stage a rally in September.
Meanwhile, CoinShares reported that global Ethereum exchange-traded funds (ETFs) posted net outflows of $5.7 million last week, indicating risk-averse sentiment among investors due to choppy price action. Notably, the negative flows were sparked by US spot Ethereum ETFs, which recorded a total net outflow of $12.4 million, following zero flows across the nine issuers, including BlackRock's ETHA and Grayscale's ETHE.
Despite the weak flows, three Ethereum ETFs feature among the top 25 ETF launches in 2024: BlackRock's ETHA, Fidelity's FETH and Bitwise ETHW.
*13* of top 25 ETF launches this yr are either bitcoin or ether related…
— Nate Geraci (@NateGeraci) September 2, 2024
Out of approx 400 new ETFs.
Top 4 ETFs all spot btc. pic.twitter.com/gIkAiIM1jZ
ETH technical analysis: Ethereum maintains consolidation within key rectangle
Ethereum is trading around $2,520 on Monday, up more than 2% on the day. In the past 24 hours, ETH has seen $38.49 million in liquidations, with long and short liquidations accounting for $27.59 million and $10.9 million, respectively.
On the four-hour chart, ETH is consolidating within a key rectangle with resistance at $2,817 and support at $2,400. ETH bounced off the support level on Sunday, stretching its time within the rectangle to 25 days.
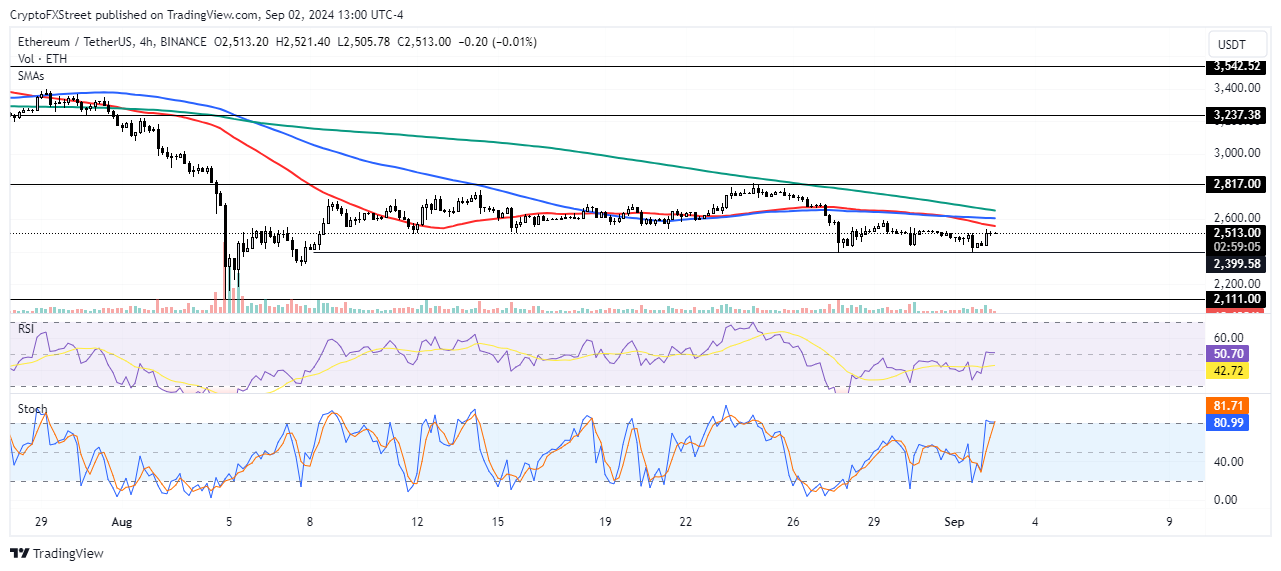
ETH/USDT 4-hour chart
The next indication of ETH's price trend will likely be a move outside the rectangle. A breakout above the $2,817 resistance will flip it into a support and help ETH rally toward the $3,237 level. It's important to note that the $2,817 level held as a support for nearly four months — April to July 2024. The 200-day, 100-day and 50-day Simple Moving Averages (SMA) also stand as potential resistance on the way up.
However, a move below the $2,400 level could spark bearish momentum and send ETH toward the support level around $2,111.
The Relative Strength Index (RSI) is attempting a move above its midline after crossing above its moving average line on the 4-hour chart. The %K line of the Stochastic Oscillator (Stoch) has entered the oversold region, indicating prices may see a downward correction.
A daily candlestick close below $2,111 may signal the end of the current bull cycle.
In the short term, ETH could decline to $2,416 to wash liquidation leverage worth over $32.47 million.
Ethereum FAQs
Ethereum is a decentralized open-source blockchain with smart contracts functionality. Serving as the basal network for the Ether (ETH) cryptocurrency, it is the second largest crypto and largest altcoin by market capitalization. The Ethereum network is tailored for scalability, programmability, security, and decentralization, attributes that make it popular among developers.
Ethereum uses decentralized blockchain technology, where developers can build and deploy applications that are independent of the central authority. To make this easier, the network has a programming language in place, which helps users create self-executing smart contracts. A smart contract is basically a code that can be verified and allows inter-user transactions.
Staking is a process where investors grow their portfolios by locking their assets for a specified duration instead of selling them. It is used by most blockchains, especially the ones that employ Proof-of-Stake (PoS) mechanism, with users earning rewards as an incentive for committing their tokens. For most long-term cryptocurrency holders, staking is a strategy to make passive income from your assets, putting them to work in exchange for reward generation.
Ethereum transitioned from a Proof-of-Work (PoW) to a Proof-of-Stake (PoS) mechanism in an event christened “The Merge.” The transformation came as the network wanted to achieve more security, cut down on energy consumption by 99.95%, and execute new scaling solutions with a possible threshold of 100,000 transactions per second. With PoS, there are less entry barriers for miners considering the reduced energy demands.
Author

Michael Ebiekutan
FXStreet
With a deep passion for web3 technology, he's collaborated with industry-leading brands like Mara, ITAK, and FXStreet in delivering groundbreaking reports on web3's transformative potential across diverse sectors. In addition to


