Ethereum Weekly Report: Lackluster performance could see ETH crash to $3,100 [Video]
- Ethereum price shows a lack of volatility as it is stuck between the 50, 100 and 200-day simple moving averages.
- Technical and on-chain metrics suggest a retest of the 200-day SMA at $3,394 is likely.
- A daily close below $3,640 will confirm a bearish outlook and could trigger a move to $3,456 or $3,394.
![Ethereum Weekly Report: Lackluster performance could see ETH crash to $3,100 [Video]](https://editorial.fxstreet.com/images/Markets/Currencies/Digital Currencies/Ethereum/ethereum_2.jpg)
Ethereum price has been stuck trading between two crucial levels for more than three weeks. The recent downswing has brought it close to a vital support barrier, a breakdown of which could catalyze further crashes for ETH.
Ethereum price needs to make tough decisions
Ethereum price and many altcoins are looking roughed up, especially after the December 3 flash crash. A further drop in ETH price could see the 50-day cross below the 100-day Simple Moving Averages (SMA) giving rise to a bearish technical signal called a death cross.
This move could exacerbate the situation for the smart contract token, leading to a retest of the 200-day SMA at $3,394. However, the 21-week SMA at $3,752 is a deciding factor that will dictate whether ETH will head lower – or retest the $4,000 psychological level.
Currently, Ethereum price is retesting this barrier in hopes of flipping it into a support level. If it is successful, ETH will enter a bullish phase and perhaps retest the 50, 100-day SMAs, or the level mentioned above.
While such an optimistic scenario is plausible, the upside potential is likely to be capped, suggesting it is inevitable ETH will revisit the 200-day SMA at $3,394. In a dire case, if this barrier fails to hold, the smart contract token will retest the $3,164 support barrier.
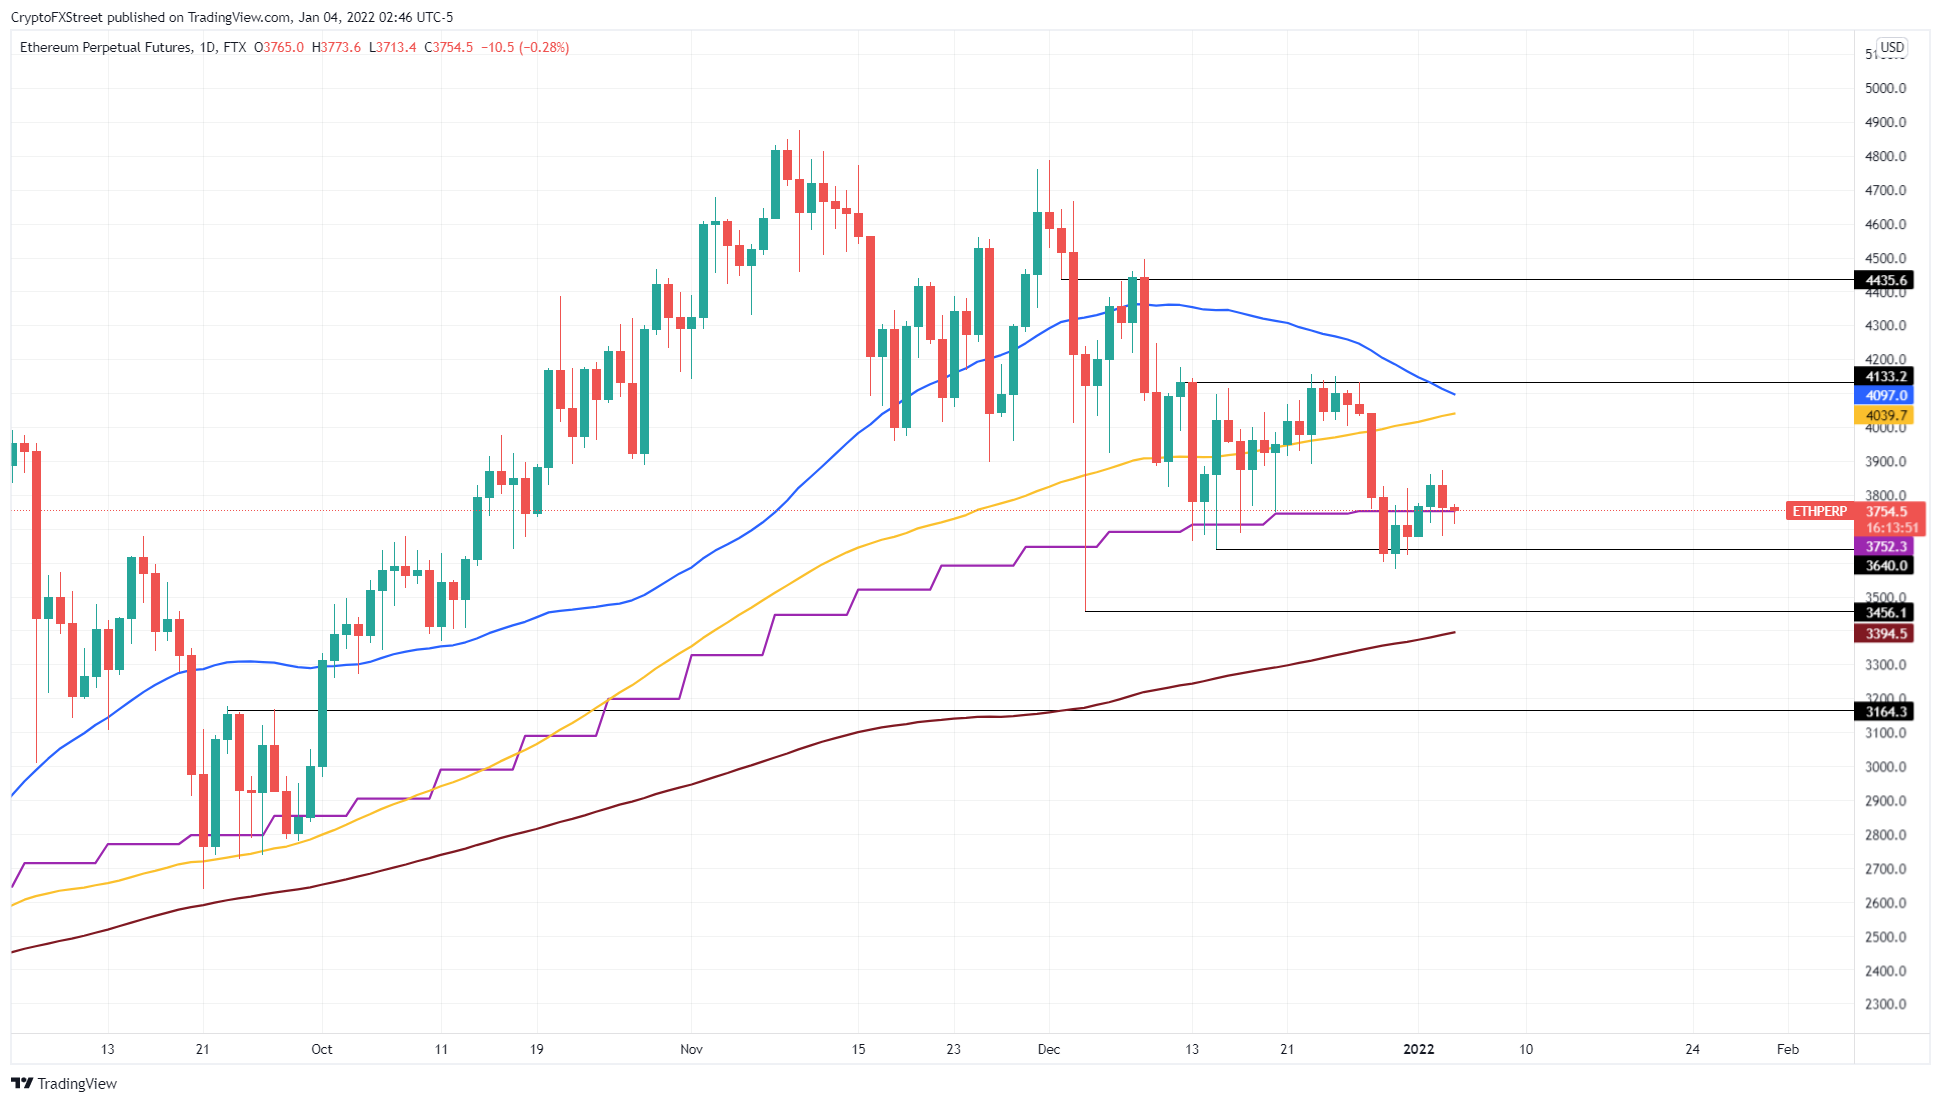
ETH/USDT 1-day chart
Ethereum price’s bearish outlook is reinforced byIntoTheBlock’s Global In/Out of the Money (GIOM) model, which shows a lack of immediate support for ETH up to $3,124.
The model shows roughly 6.97 million addresses purchased 9.43 million ETH at $3,124,making it a strong line of defense. Anything before that is like walking on thin ice for ETH.
Upside for ETH seems to be capped at $4,079, where roughly 4.22 million addresses purchased 16.14 million ETH. Any short-term spikes in buying pressure are likely to be met with selling pressure from holders at this level, therefore, wanting to break even.
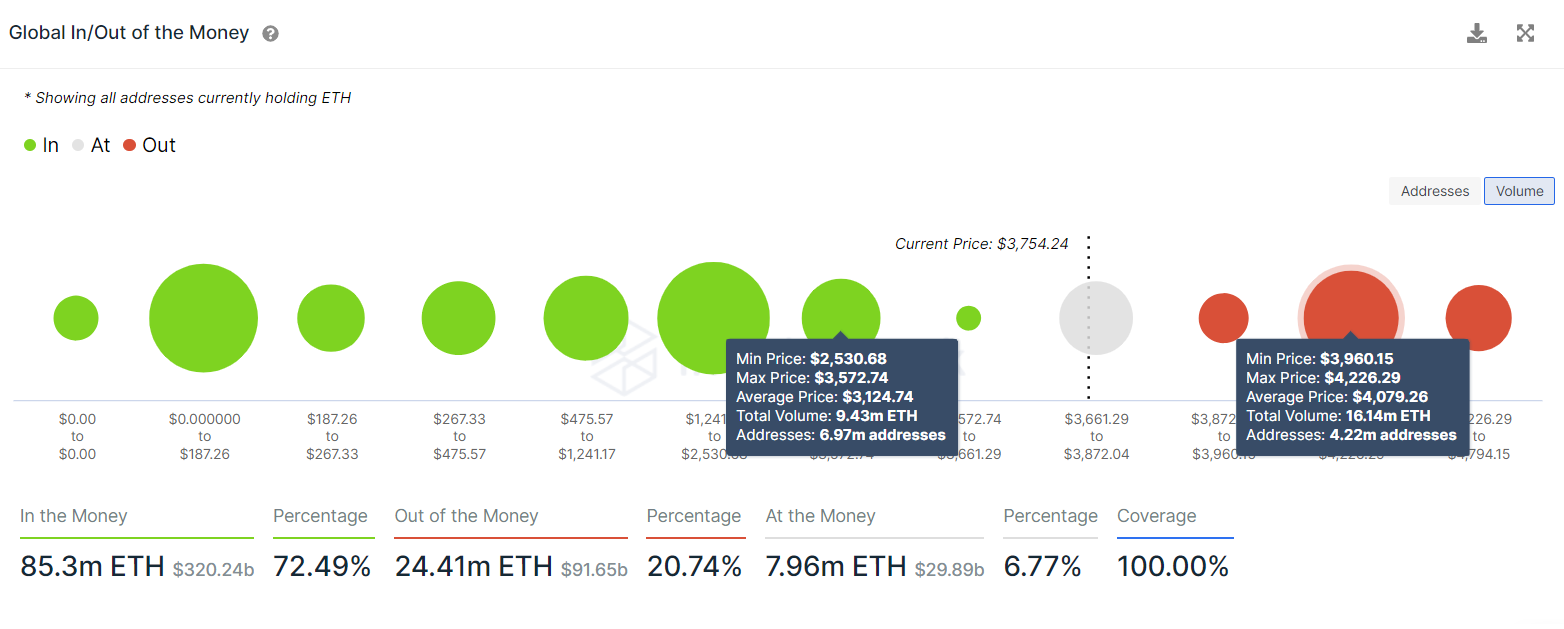
ETH GIOM
Another on-chain metric that explains the lackluster performance of Ethereum price is the daily active addresses (DAA). The DAA currently hovers at 179,000 and is well below the 50 SMA and 200 SMA, which produced a death cross on December 26, 2021, suggesting that there has been a prolonged decline in user interest.
 [12.18.27, 04 Jan, 2022]-637768833969574654.png)
ETH DAA
Further signs of a potential crash for Ethereum price are shown by the Market Value to Realized Value (MVRV) model, hovering at 24.26%.
This on-chain metric is used to determine the average profit/loss of investors that purchased ETH over the past year. The current value suggests that these holders are in profit and could be a source of selling pressure if they decided to part ways with their ETH.
Hence, a potential flash crash cannot be overruled for the smart contract token.
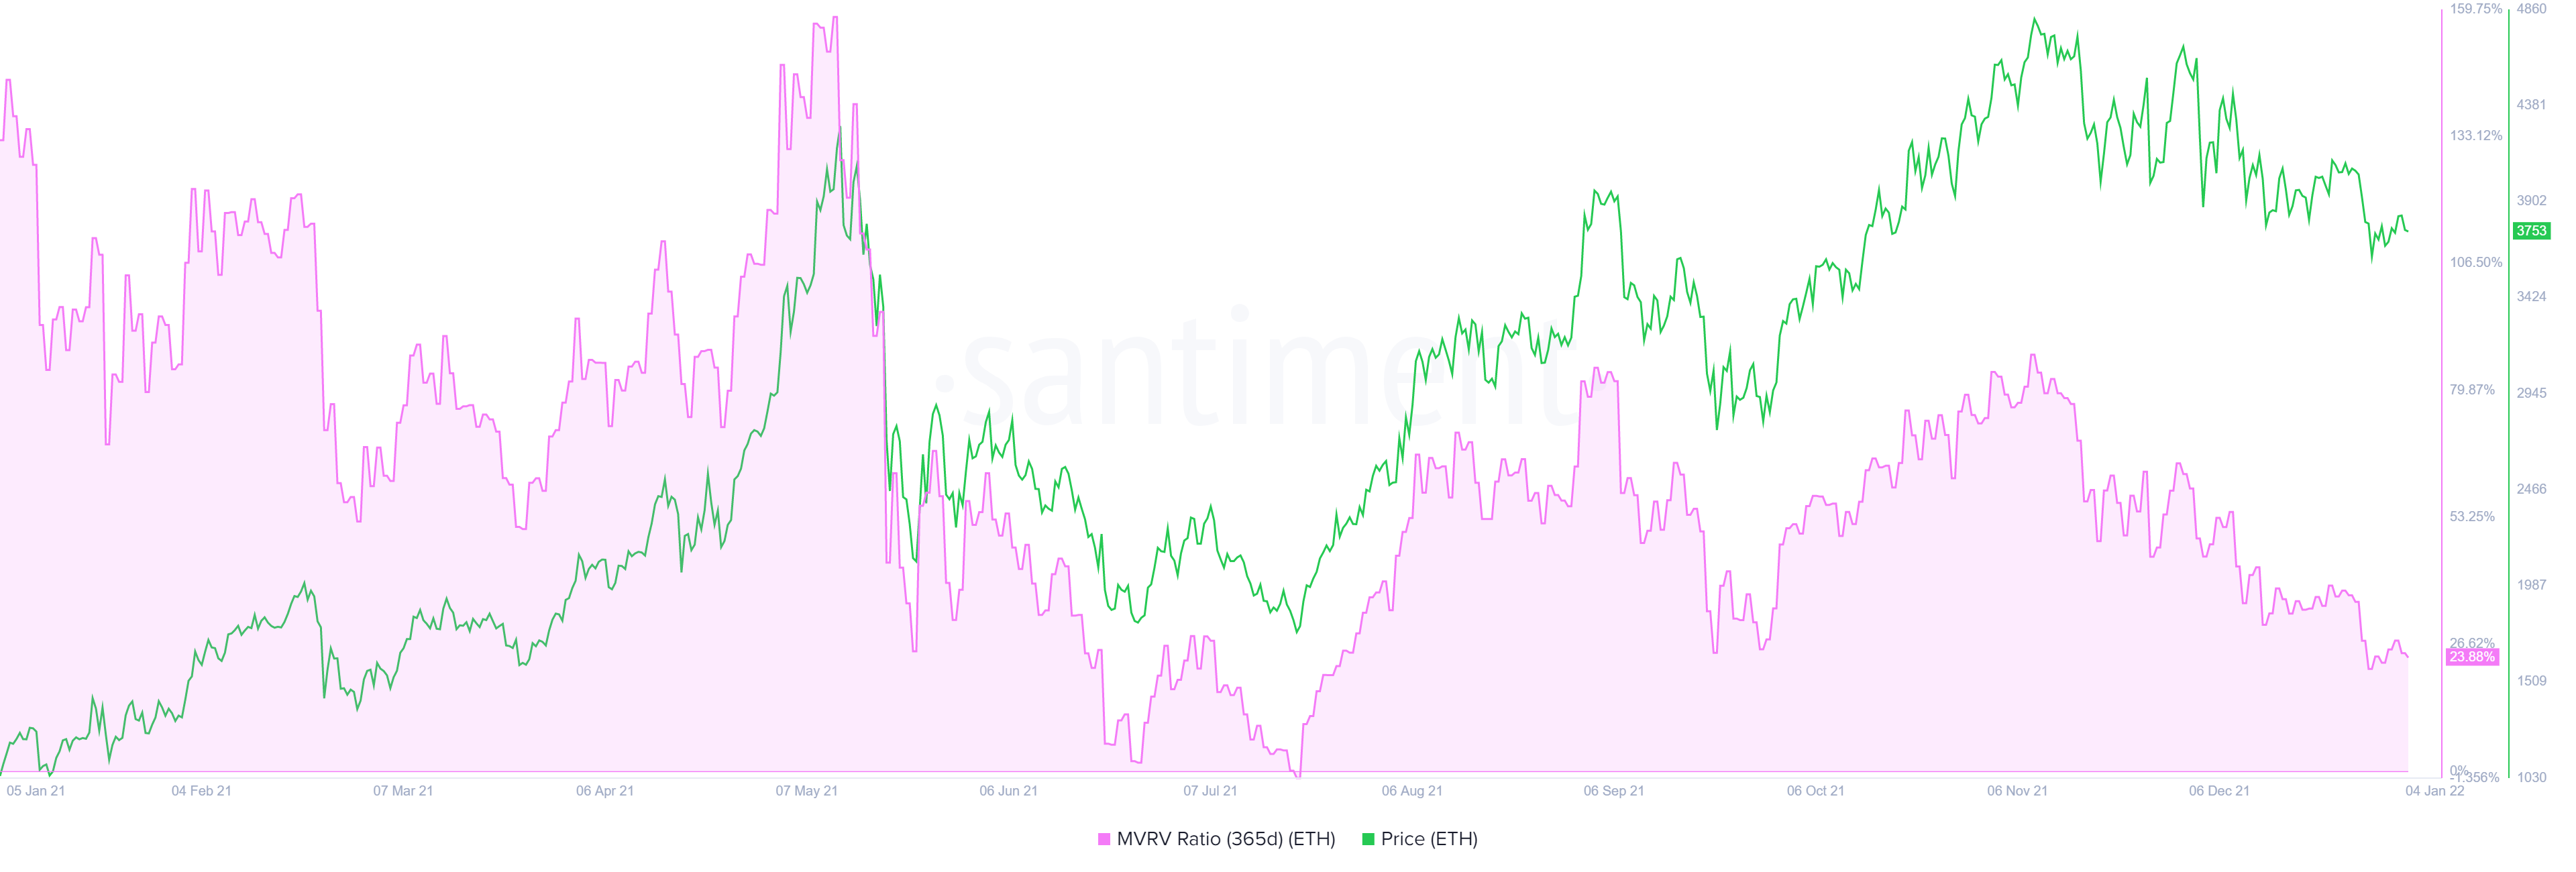
ETH 365-day MVRV
This bearish outlook can also be clearly pictured with the supply distribution chart, which serves as a proxy for institutional investment interests. This shows whales holding between 10,000 and 100,000 ETH have been offloading their assets for more than two months.
The number of such investors dropped by 54, from 1,197 on October 15, 2021, to 1,143 on January 3. This 4.5% decline suggests that market participants are booking profits probably in anticipation of a further drop in the Ethereum price.
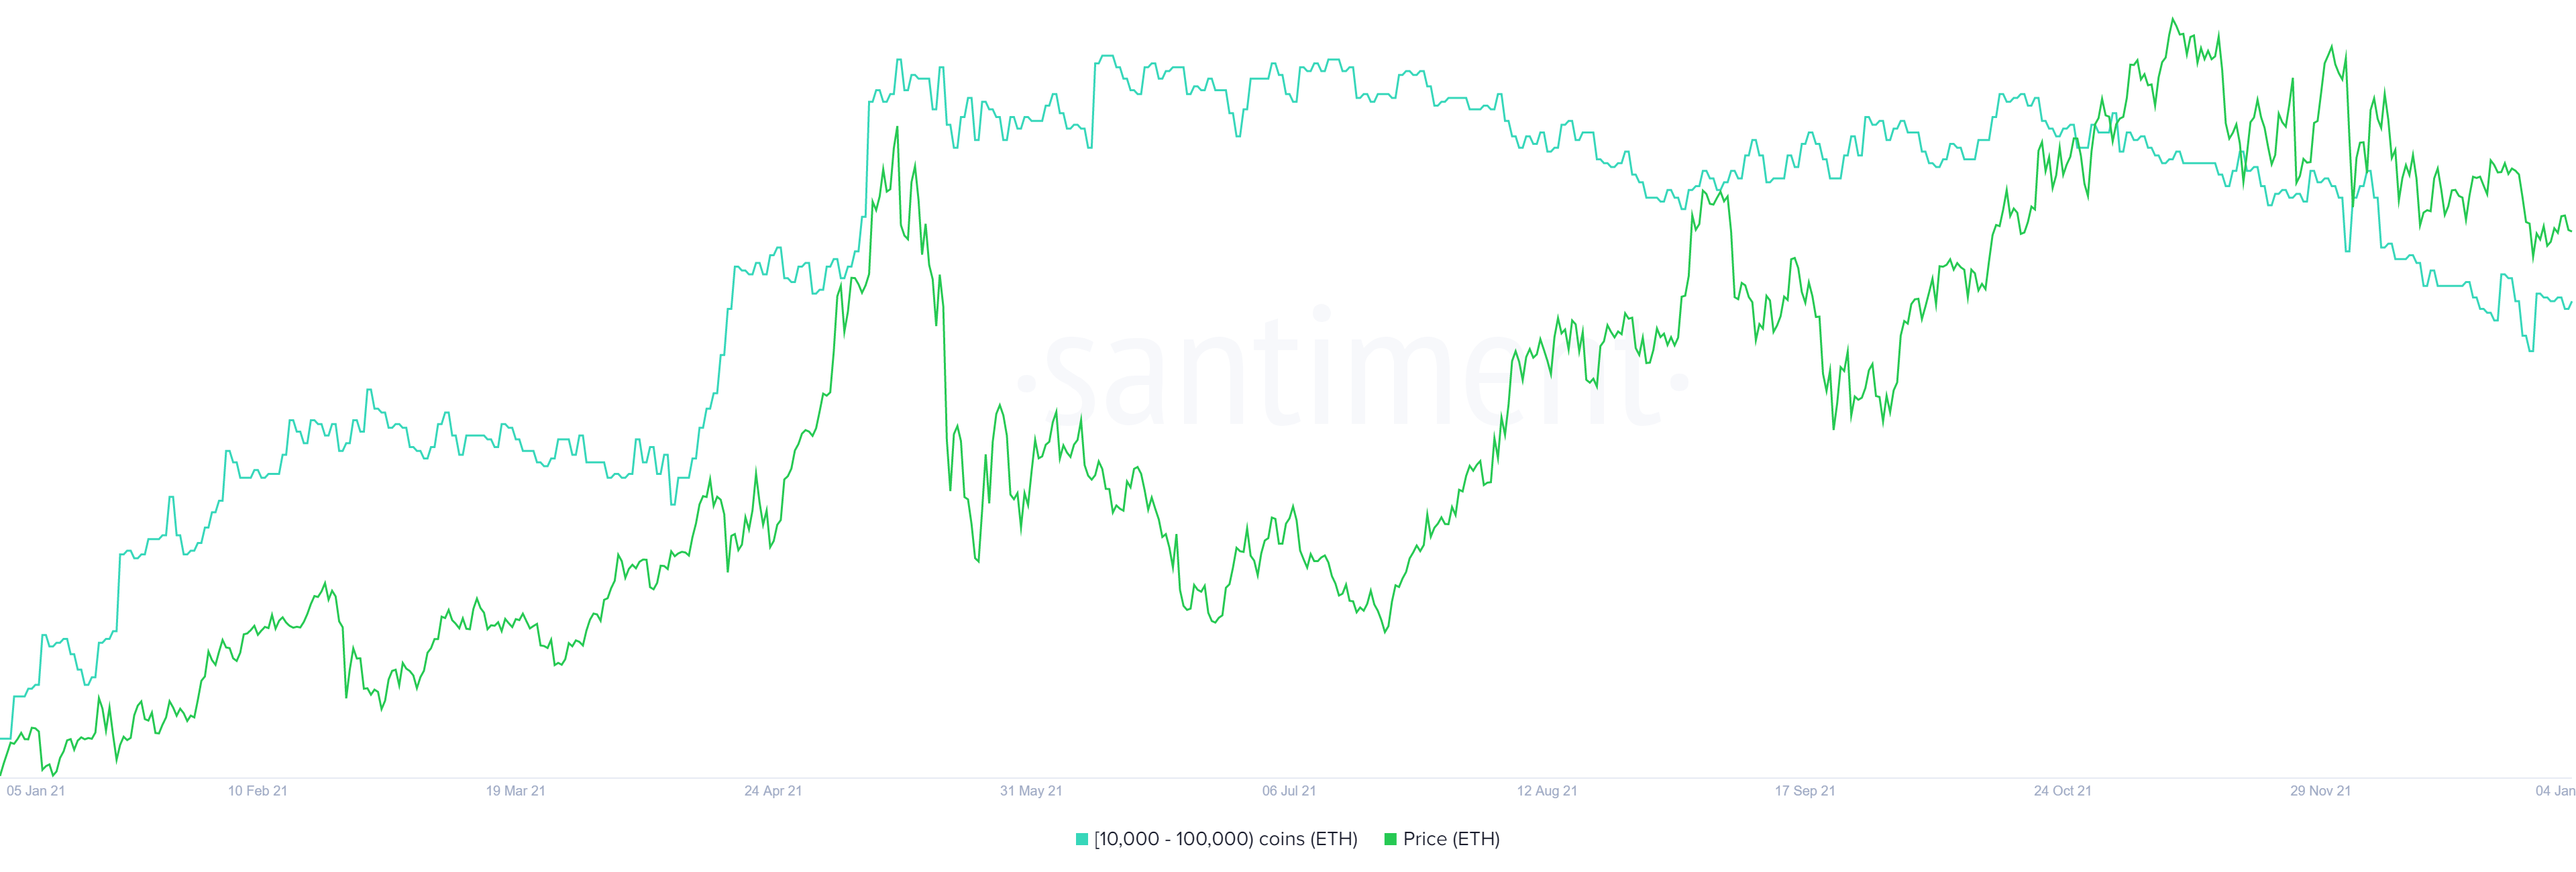
ETH supply distribution
While things are looking grim from a long-term perspective, a decisive daily candlestick close above $4,100 will set up a higher high and suggest that buyers are willing to go the extra mile. A swing high above $4,500 will invalidate the bullish thesis and create FOMO among buyers and is likely to propel Ethereum price to create a new all-time high at $5,000.
Author

Akash Girimath
FXStreet
Akash Girimath is a Mechanical Engineer interested in the chaos of the financial markets. Trying to make sense of this convoluted yet fascinating space, he switched his engineering job to become a crypto reporter and analyst.


