Ethereum Technical Analysis: ETH/USD there could be harsh consequences if $240-225 does not hold
- Ethereum price on Wednesday in the second part of the session is nursing losses of some 0.55%.
- ETH/USD price action continues to retest a breached daily pennant pattern structure.
- A critical daily demand zone running from $240-225 is being tested to the downside, failure to support the price could invite a strong wave of selling.

Spot rate: 239.53
Relative change: -0.95%
High: 248.28
Low: 238.79
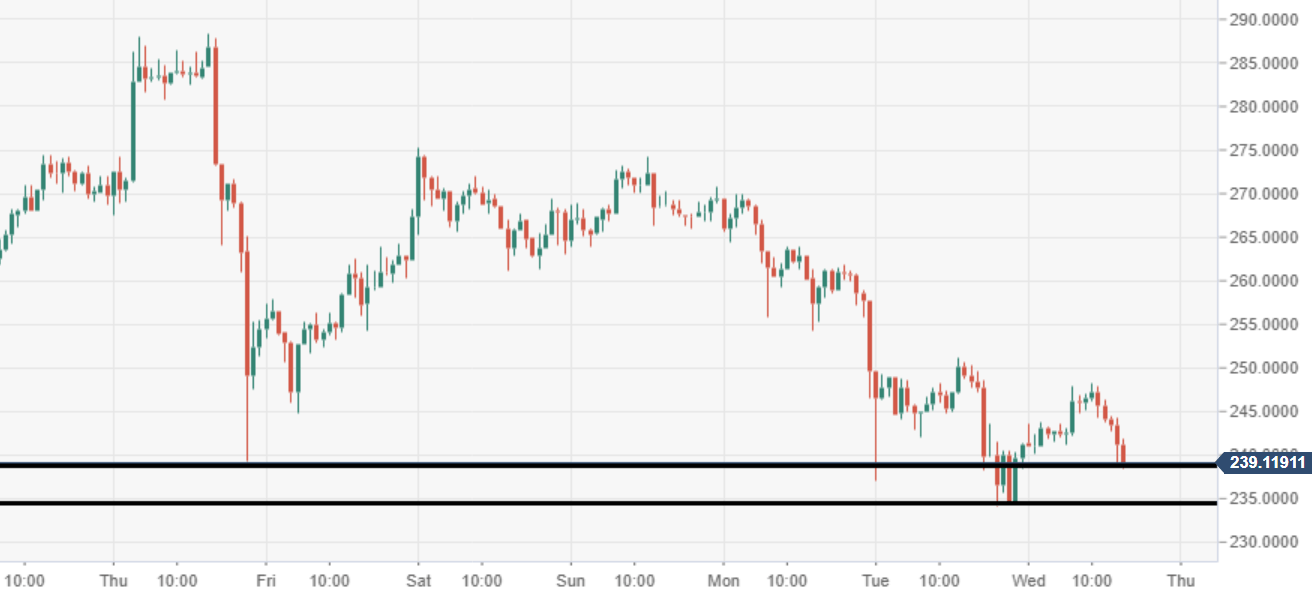
ETH/USD 60-minute chart
- The near-term bottom can be seen at $235, 60-minute support, preventing the price from dropping further at present.
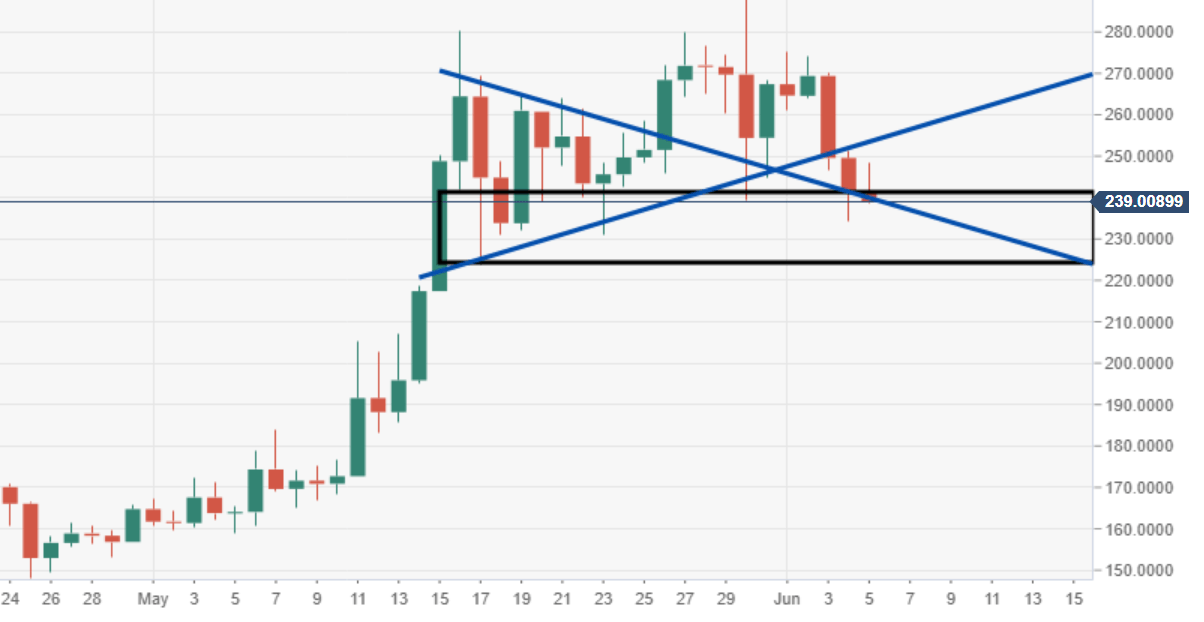
ETH/USD daily chart
- Should the vital zone of $240-225 fail to hold, the price may be forced to give up $200 price mark.
Author

Ken Chigbo
Independent Analyst
Ken has over 8 years exposure to the financial markets. He started his career as an analyst, covering a variety of asset classes; forex, fixed income, commodities and equities.
More from Ken Chigbo


