Ethereum technical analysis: ETH/USD risk of a potential breakout from a bearish technical structure
- Ethereum price in the second half of Monday is trading in the red, down some 2.30%.
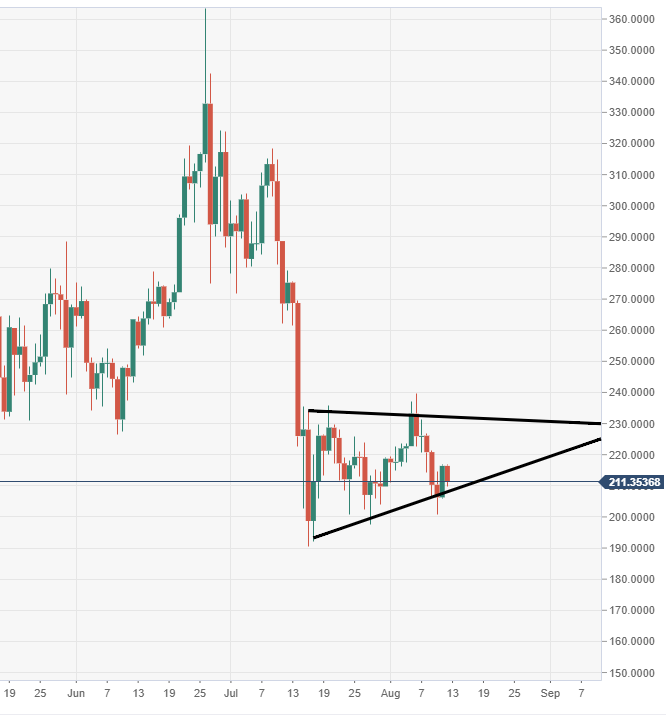
- ETH/USD is moving within a bearish technical structure via the daily, pennant subject to a potential breakout south.
- A break of the noted pattern could invite a fresh wave of selling pressure, with a possible move below $200.

Spot rate: 211.43
Relative change: -2.30%
High: 216.69
Low: 209.78
ETH/USD daily chart
- Price action is moving within a bearish pennant structure as seen via the daily chart view.
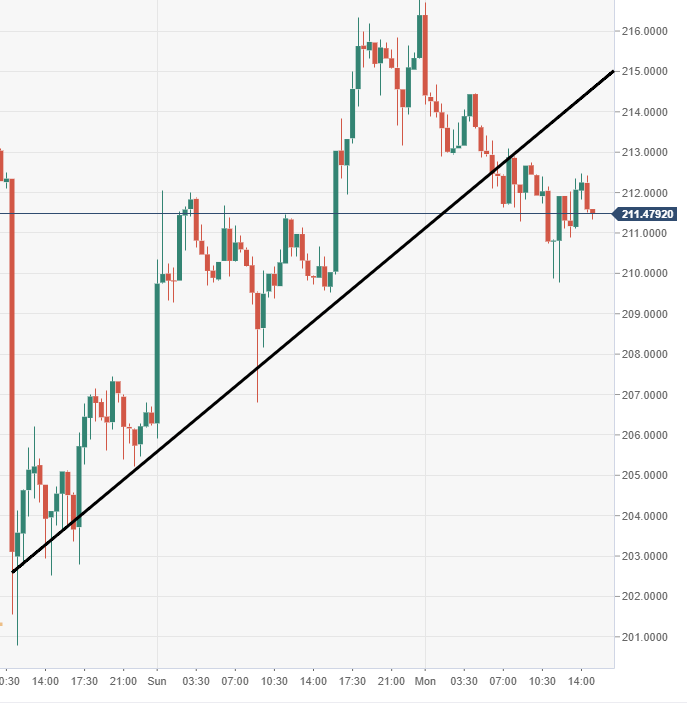
ETH/USD 30-minute chart
- The price via the 30-minute chart view has broken out south from an ascending trend line of support.
Author

Ken Chigbo
Independent Analyst
Ken has over 8 years exposure to the financial markets. He started his career as an analyst, covering a variety of asset classes; forex, fixed income, commodities and equities.
More from Ken Chigbo


