ETH/USD daily chart
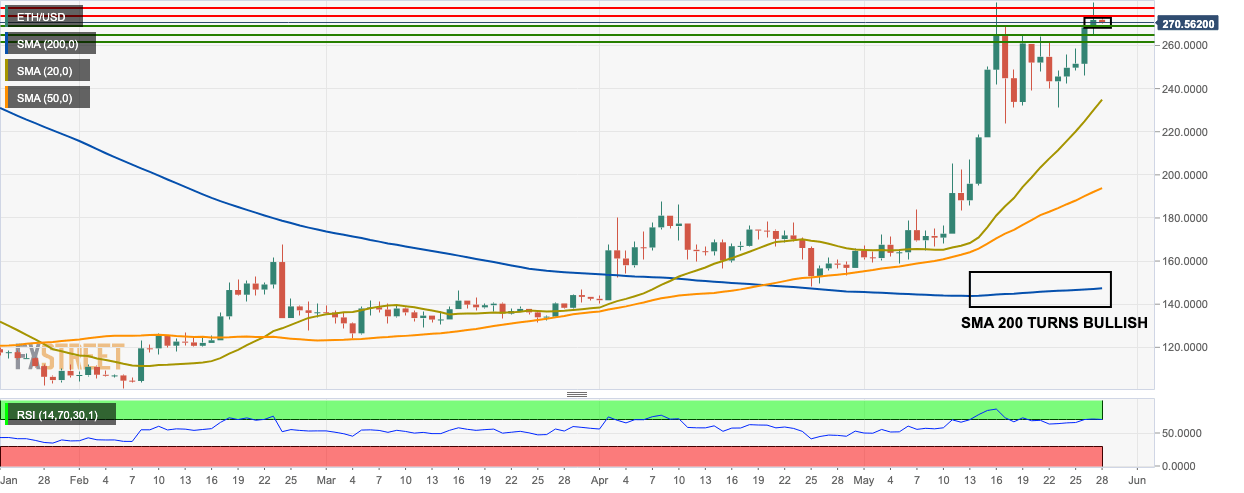
- The bears have control over the market this Tuesday as the price is consolidating between $270-$271.
- The 200-day simple moving average (SMA 200) has turned bullish, which is a great sign for holders.
- The price is trending above the SMA 200, SMA 50, and SMA 20 curves.
- The nearest support level lies at $269 and the closest resistance level lies at $274.25.
- The relative strength index (RSI) indicator is inside the overbought zone, trending around 70.25.
ETH/USD 4-hour chart
- The 4-hour market supported by the red and green cloud of the Ichimoku indicator.
- The future sentiment of the market, as per the Ichimoku indicator, is bullish.
- The eight latest sessions of the 4-hour price chart are trending horizontally.
- Two out of the three latest sessions in the Elliot oscillator are bearish.
ETH/USD hourly chart
- The hourly ETH/USD market found support on the upward trending line.
- The second last session went above the upper curve of the 20-day Bollinger band and the bears immediately corrected that in the latest session.
- The SMA 20 curve has flat-lined and is acting as immediate support for the market.
- The signal line is looking to crossover with the moving average convergence/divergence (MACD) line indicating decreasing bearish momentum.
Key levels
Note: All information on this page is subject to change. The use of this website constitutes acceptance of our user agreement. Please read our privacy policy and legal disclaimer. Opinions expressed at FXstreet.com are those of the individual authors and do not necessarily represent the opinion of FXstreet.com or its management. Risk Disclosure: Trading foreign exchange on margin carries a high level of risk, and may not be suitable for all investors. The high degree of leverage can work against you as well as for you. Before deciding to invest in foreign exchange you should carefully consider your investment objectives, level of experience, and risk appetite. The possibility exists that you could sustain a loss of some or all of your initial investment and therefore you should not invest money that you cannot afford to lose. You should be aware of all the risks associated with foreign exchange trading, and seek advice from an independent financial advisor if you have any doubts.
Recommended Content
Editors’ Picks
MANTA suffers 4% pullback after unlocking tokens worth $40 million
Manta Network (MANTA) unlocked over 8% of its circulating supply on Thursday. The unlocked tokens were airdropped and distributed in public sale, according to data from Tokenunlocks.
XRP struggles to recover as lingering Ripple lawsuit could reach Supreme Court, former SEC litigator says
The SEC vs. Ripple potential showdown at the Supreme Court is likely, says former SEC litigator Ladan Stewart. XRP Ledger calls developers, businesses and investors to build on the blockchain, extending Apex 2024 registration until April 30.
Bitcoin Layer 2 Merlin chain TVL climbs 20%, defying broad market correction
Merlin chain’s TVL added 20% this week, and crossed $800 million on Thursday. Bitcoin Layer 2 assets noted double-digit losses in the past week. Stacks, Elastos, SatoshiVM, BVM are hit by a correction as Bitcoin hovers around $61,000.
If Bitcoin restarts bull run, these altcoins are likely to explode Premium
If Bitcoin’s consolidation ends and the bull run resumes, altcoins are likely going to trigger a massive rally. Last cycle’s hot tokens like SOL, AVAX, WIF, ONDO, etc., could see renewed enthusiasm.
Bitcoin: BTC’s rangebound movement leaves traders confused
Bitcoin (BTC) price has been hovering around the $70,000 psychological level for a few weeks, resulting in a rangebound movement. This development could lead to a massive liquidation on either side before a directional move is established.