Ethereum technical analysis: ETH/USD narrowing subject to an explosive breakout
- Ethereum price on Friday is trading in minor positive territory, holding gains of some 1%.
- ETH/USD price action has been stuck within a narrowing range since the middle of May.
- A bullish daily technical formation remains intact, flag pattern, which is subject to a breakout.

Spot rate: 257.80
Relative change: +1.00%
High: 258.63
Low: 251.98
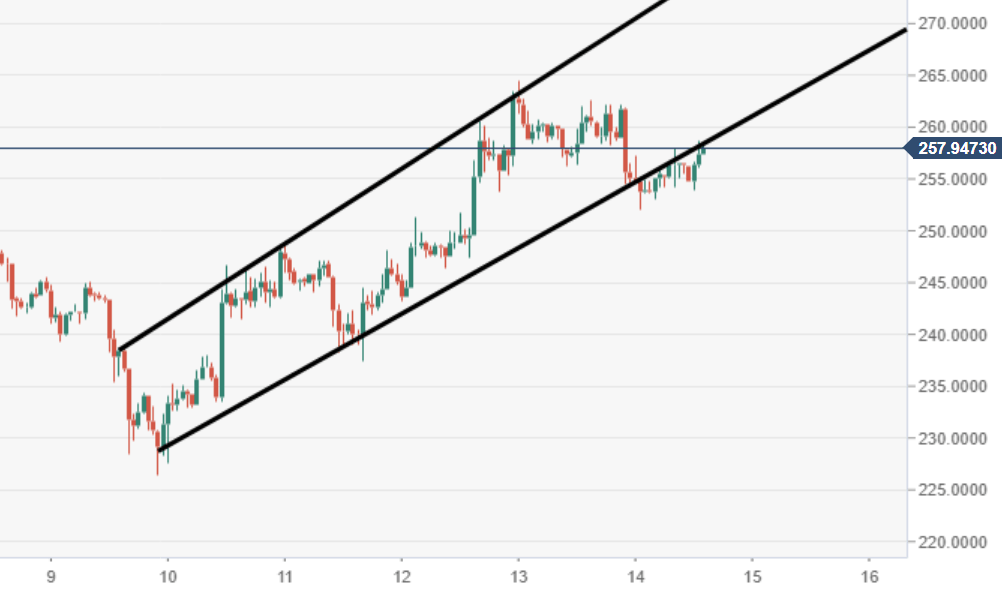
ETH/USD 60-minute chart
- Price action via the 60-minute chart view has broken out from a rising channel formation. It has since retested, which makes room for further downside pressure.
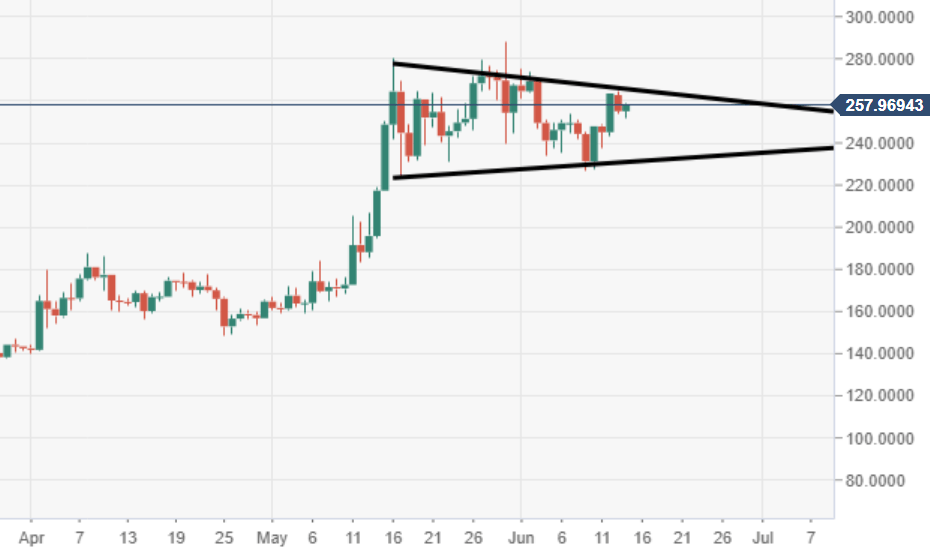
ETH/USD daily chart
- ETH/USD continues to move within a bullish flag formation, eyes remain on a breakout. The major barrier to the upside is $280.
Author

Ken Chigbo
Independent Analyst
Ken has over 8 years exposure to the financial markets. He started his career as an analyst, covering a variety of asset classes; forex, fixed income, commodities and equities.
More from Ken Chigbo


