Ethereum Technical Analysis: ETH/USD little pullback allows some consolation for the bulls after brutal beating
- Ethereum price on Thursday holding small gains of just over 1.5%, after the heavy selling on Wednesday and overnight.
- ETH/USD bulls make a breakout from a near-term descending wedge pattern.

ETH/USD 60-minute chart
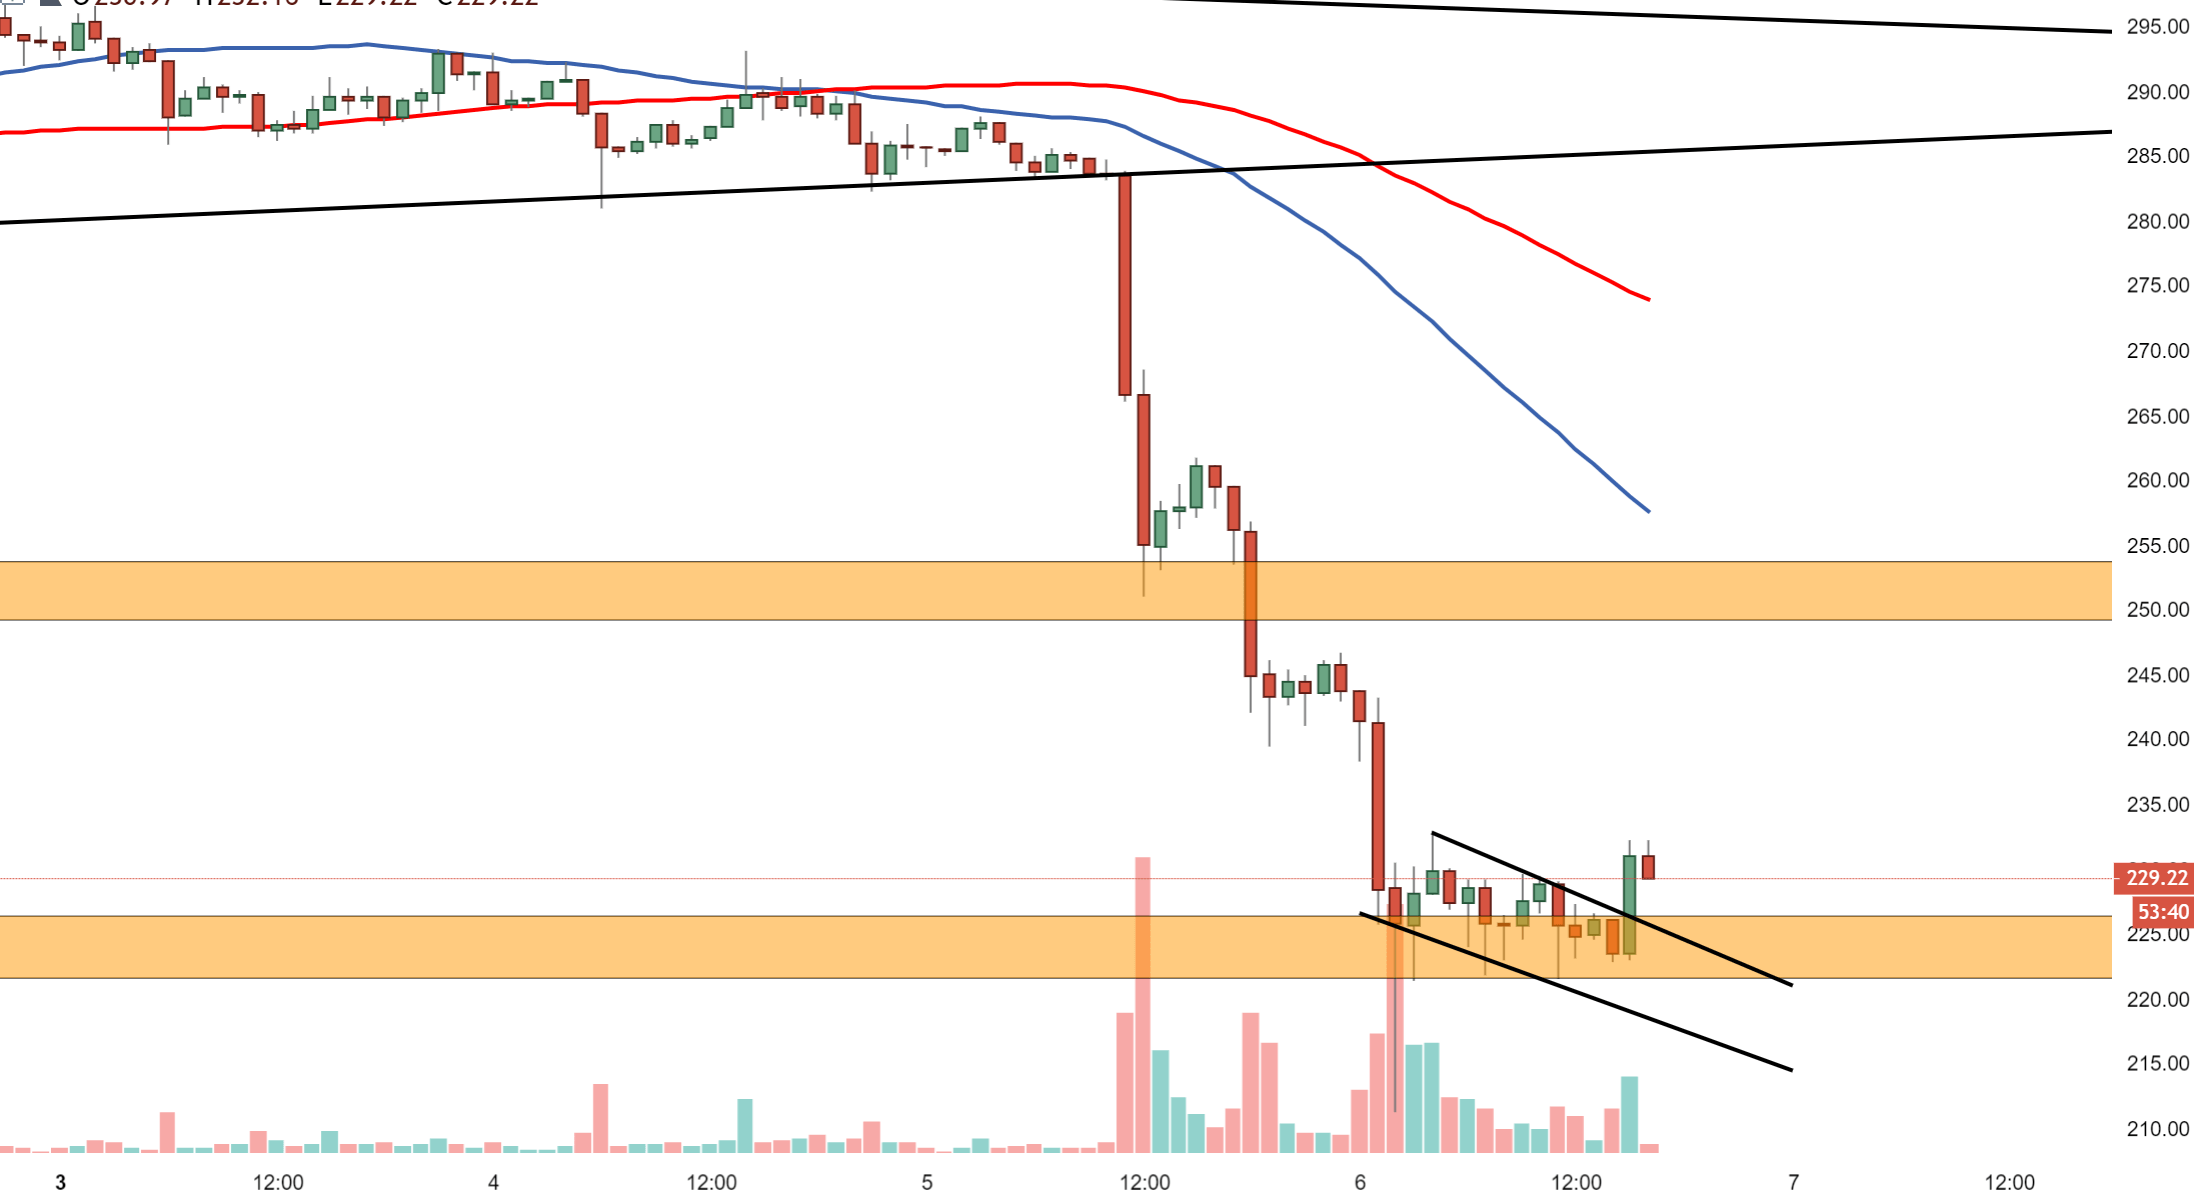
Spot rate: 230.72
Relative change: -1.48%
High: 232.78
Low: 211.19
Trend: Bullish/Neutral
Resistance 1: 232.80, resistance on 60-minute chart.
Resistance 2: 245.85, consolidation area before resumed selling pressure.
Resistance 3: 249.20, former demand area, new potential supply.
Support 1: 225.90, on top of broken wedge pattern.
Support 2: 221.55, demand zone.
Support 3: 218.23, inner lower trend line of descending wedge.
Author

Ken Chigbo
Independent Analyst
Ken has over 8 years exposure to the financial markets. He started his career as an analyst, covering a variety of asset classes; forex, fixed income, commodities and equities.


