Ethereum technical analysis: ETH/USD double bottom in focus

- Ethereum price is trading in the red, down 0.60% the session on Monday.
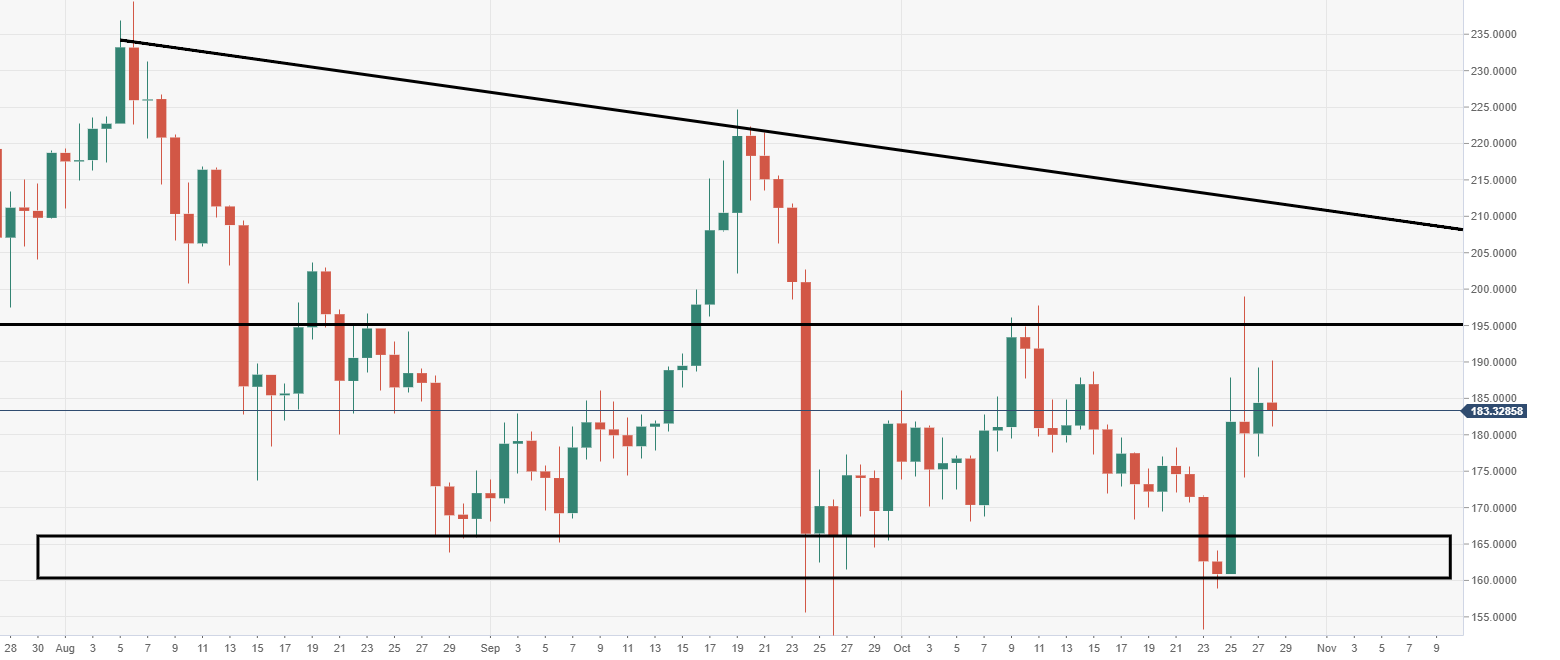
- ETH/USD has managed to receive support within a big demand area at $160 territory.
- Price action has formed a double bottom, with the bulls needing to challenge and breakdown the neckline.
ETH/USD daily chart
The next major barrier is eyed at $195, tracking as the potential neckline of the noted double bottom.
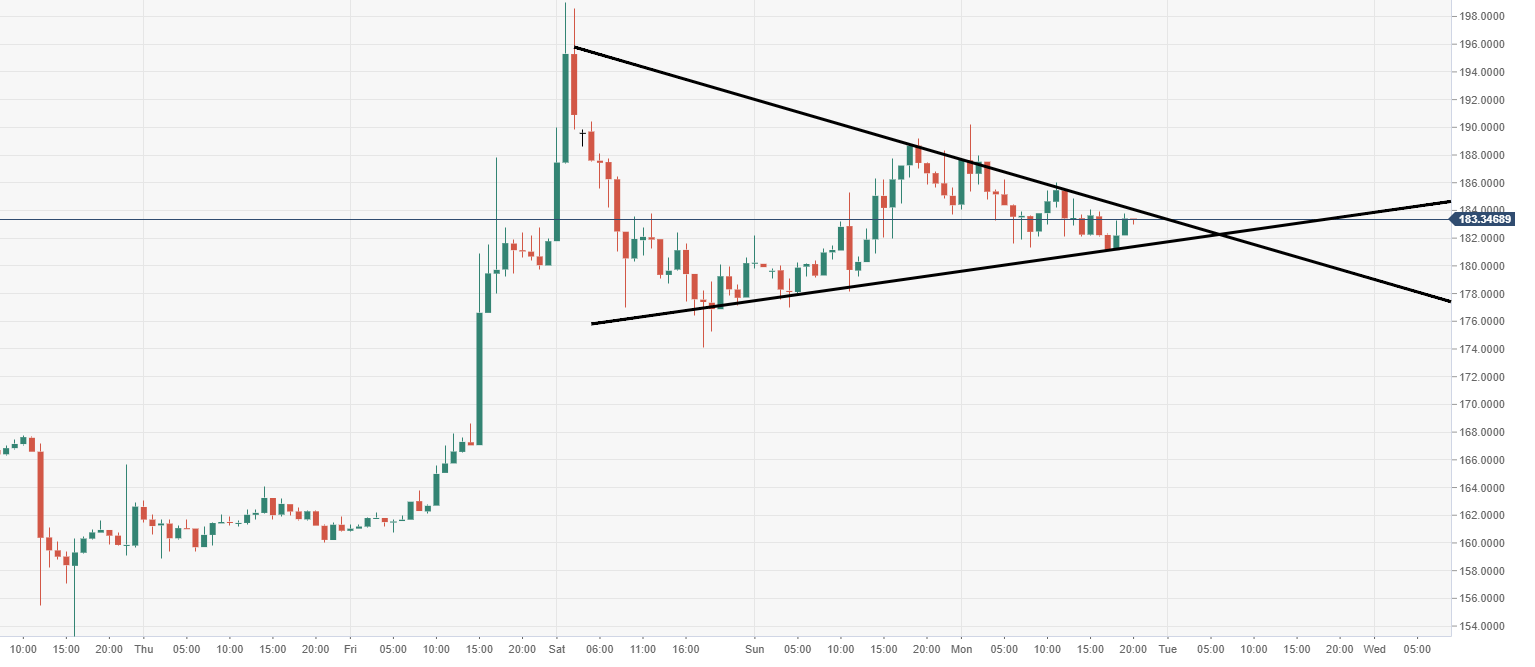
ETH/USD 60-minute chart
Price action is narrowing within a potential triangular structure, subject to a near-term breakout.
Spot rate: 183.33
Relative change: -0.60%
High: 190.19
Low: 181.08
Author

Ken Chigbo
Independent Analyst
Ken has over 8 years exposure to the financial markets. He started his career as an analyst, covering a variety of asset classes; forex, fixed income, commodities and equities.
More from Ken Chigbo


