Ethereum technical analysis: ETH/USD critical demand zone holds the price for now
- Ethereum price is trading in the green, up with gains of 4.80% in the second half of the session.
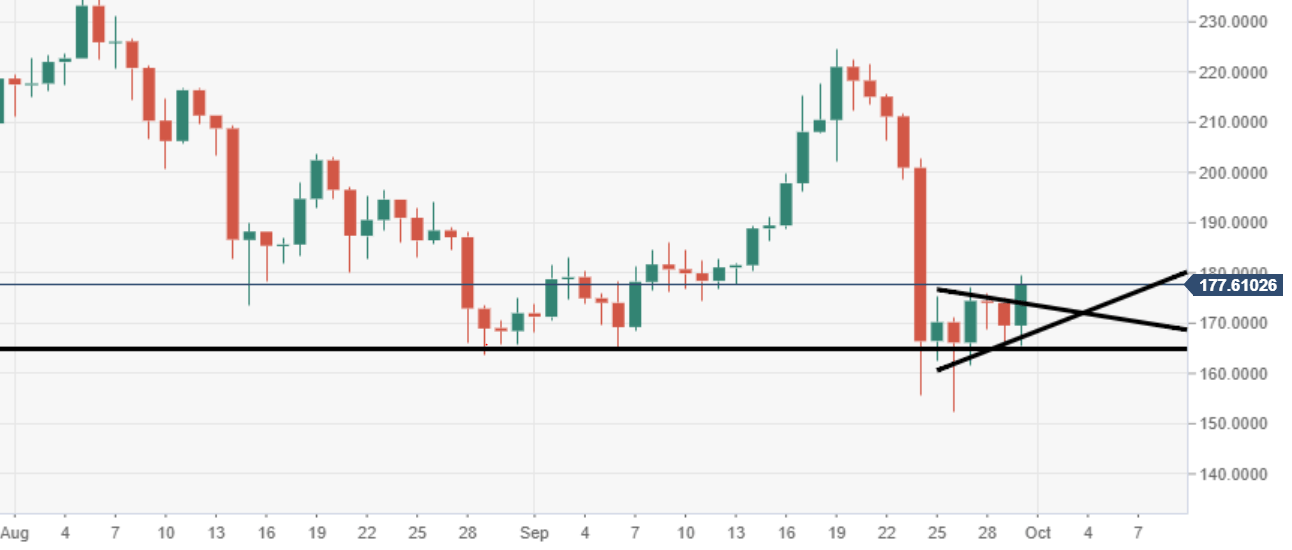
- ETH/USD bulls are trying to escape a bearish pennant structure via the daily.
- The price had been consolidating over the last six sessions following the steep fall between 20-24 September.

ETH/USD daily chart
There is critical daily support seen at $165, failure to hold could invite a fresh wave of selling pressure. Should the price force a daily closure out from the pennant, eyes will be on $180 and then $200 resistance areas.
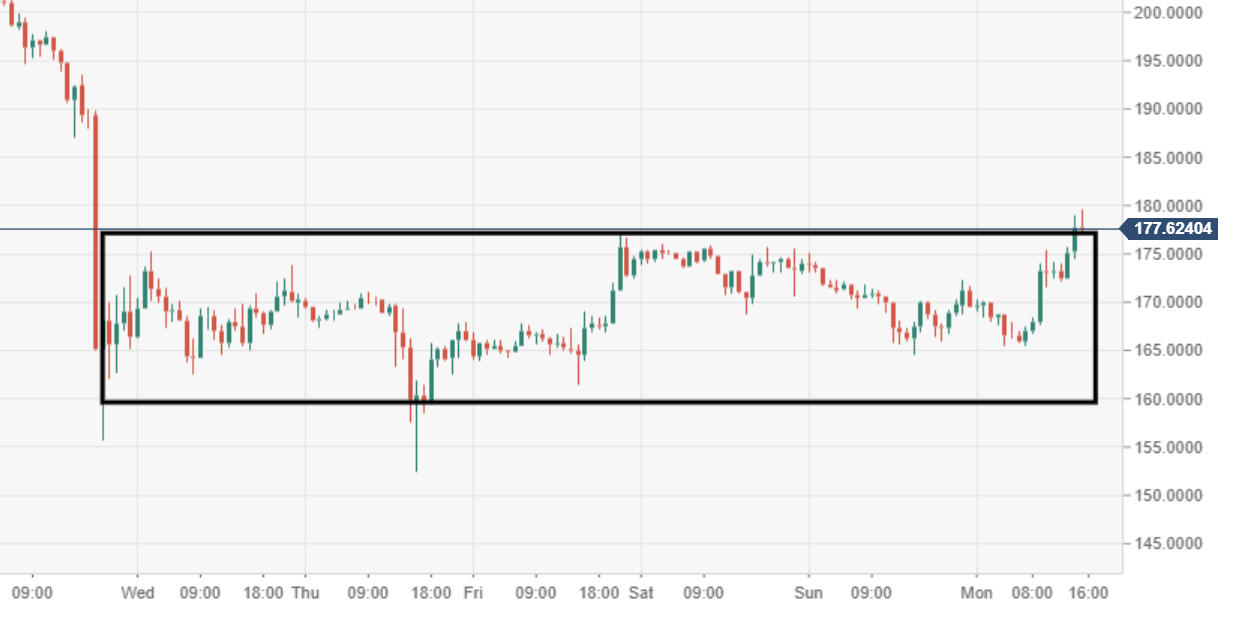
ETH/USD 60-minute chart
The price is edging out from a narrowing range block formation seen via the 60-minute.
Spot rate: 177.63
Relative change: +4.80%
High: 179.57
Low: 165.44
.
Author

Ken Chigbo
Independent Analyst
Ken has over 8 years exposure to the financial markets. He started his career as an analyst, covering a variety of asset classes; forex, fixed income, commodities and equities.
More from Ken Chigbo


