Ethereum Technical Analysis: ETH/USD bulls breakout from bullish flag pattern
- Ethereum price on Tuesday into the second part of the session, holding gains of some 0.6%,
- ETH/USD price behavior suggests another extended move to the upside is potentially around corner.

Spot rate: 96.13
Relative change: +0.61%
High: 96.70
Low: 92.94
Trend: Bullish
Resistance 1: 97.50-98.00, near-term supply area.
Resistance 2: 101.21, daily pivot point resistance.
Resistance 3: 106.95, daily pivot point resistance.
Support 1: 87.41, daily pivot point resistance.
Support 2: 79.36, daily pivot point support.
Support 3: 73.61, daily pivot point support.
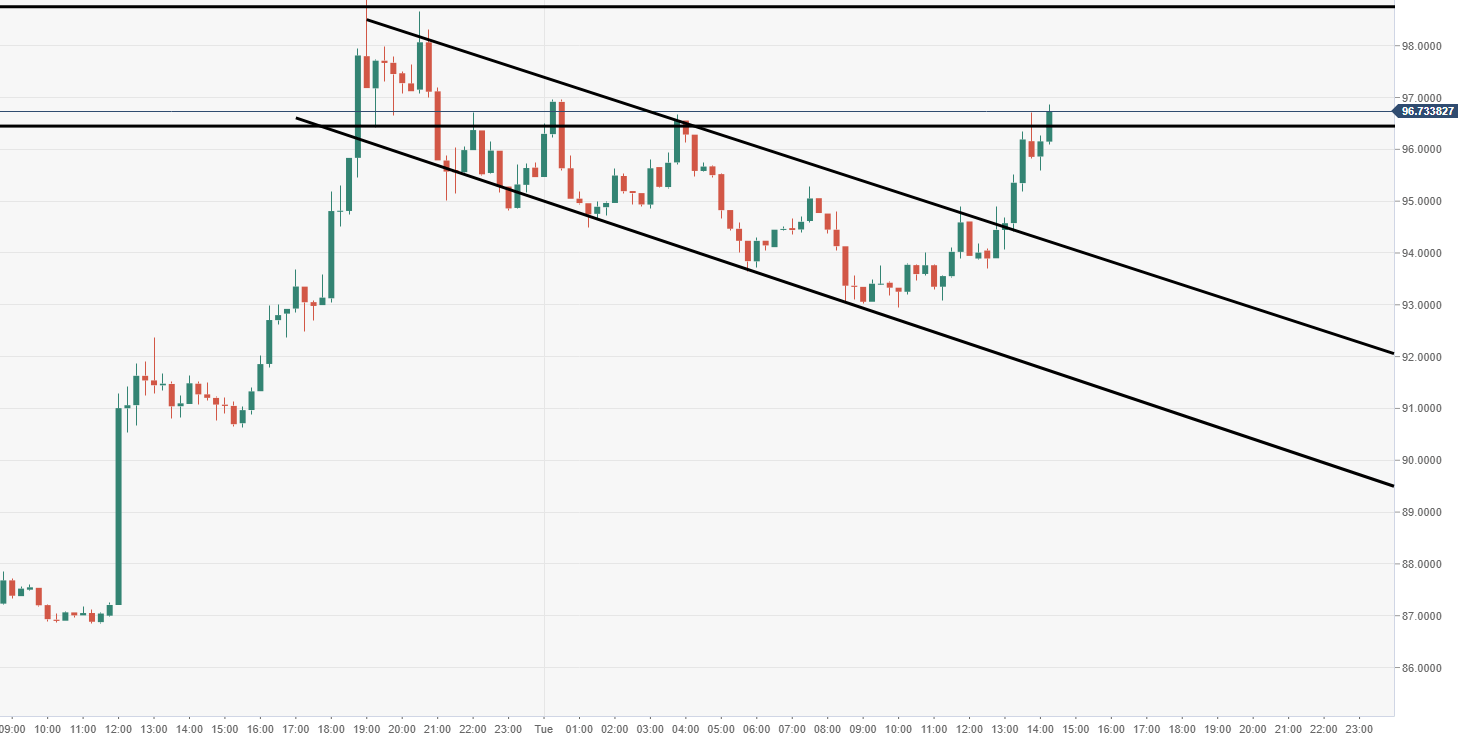
ETH/USD 60-minute chart
- Bullish momentum is eyed, with price set to retest the near-term barrier of supply, $97.50-98.00.
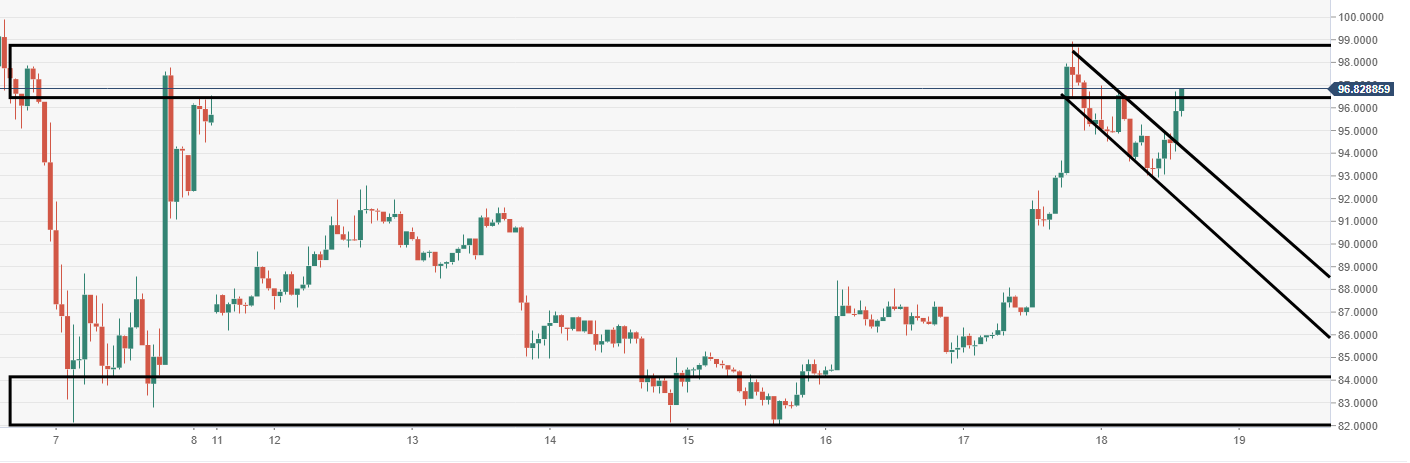
ETH/USD 4-hour chart
- A breakout of the supply area market on the chart, should see a renewed wave of buying pressure. Sending the price back well into the $100 area.
Author

Ken Chigbo
Independent Analyst
Ken has over 8 years exposure to the financial markets. He started his career as an analyst, covering a variety of asset classes; forex, fixed income, commodities and equities.


