Ethereum Technical Analysis: ETH/USD a sitting duck subject to large bear attack
- Ethereum price trading down just shy of 1% into the latter stages of the session on Friday.
- ETH/USD price action like a number of other cryptocurrencies, has formed a range-block. Subject to a breakout south.

ETH/USD 15-minute chart
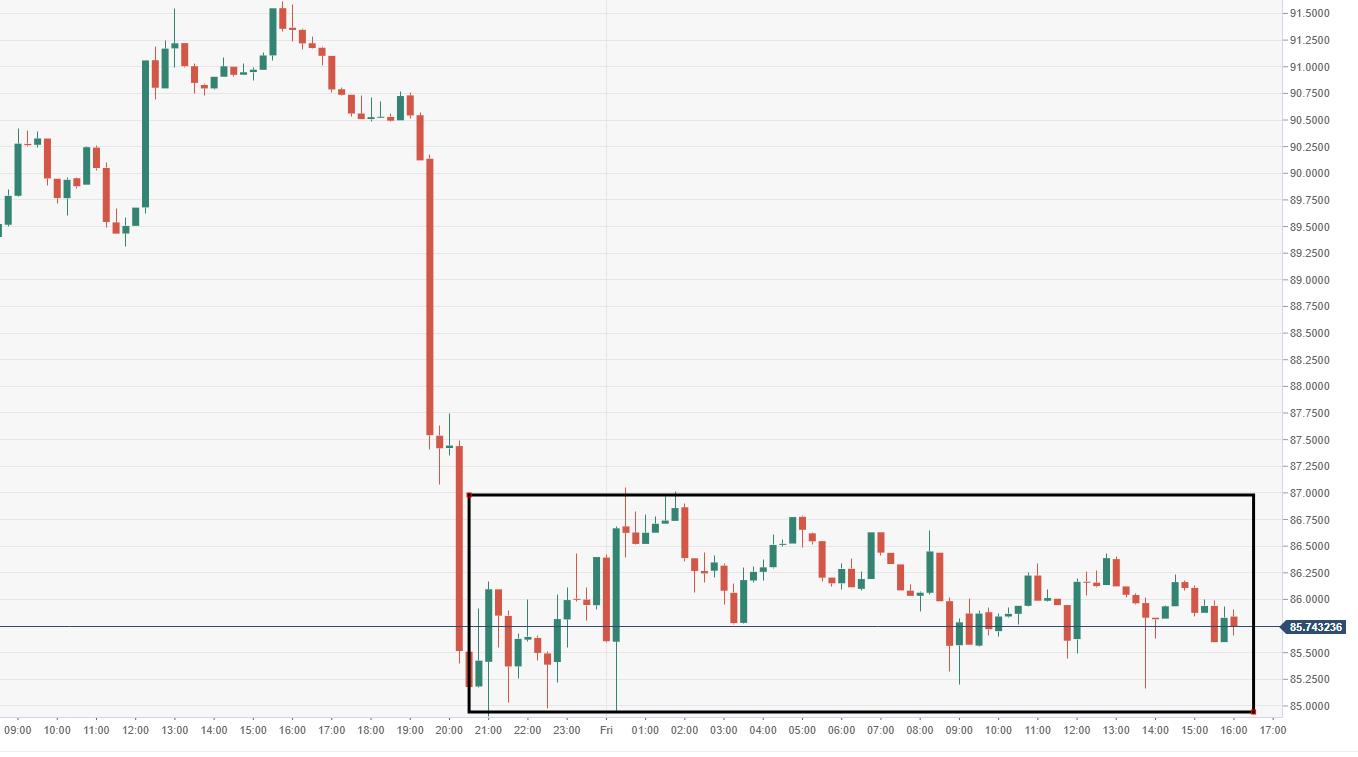
Spot rate: 85.82
Relative change: -0.85%
High: 87.05
Low: 86.66
Trend: Bearish
Support 1: 83.66, daily pivot point support.
Support 2: 80.93, daily pivot point support.
Support 3: 76.95, daily pivot point support.
Resistance 1: 90.37, daily pivot point resistance.
Resistance 2: 94.35, daily pivot point resistance.
Resistance 3: 97.09, daily pivot point resistance.
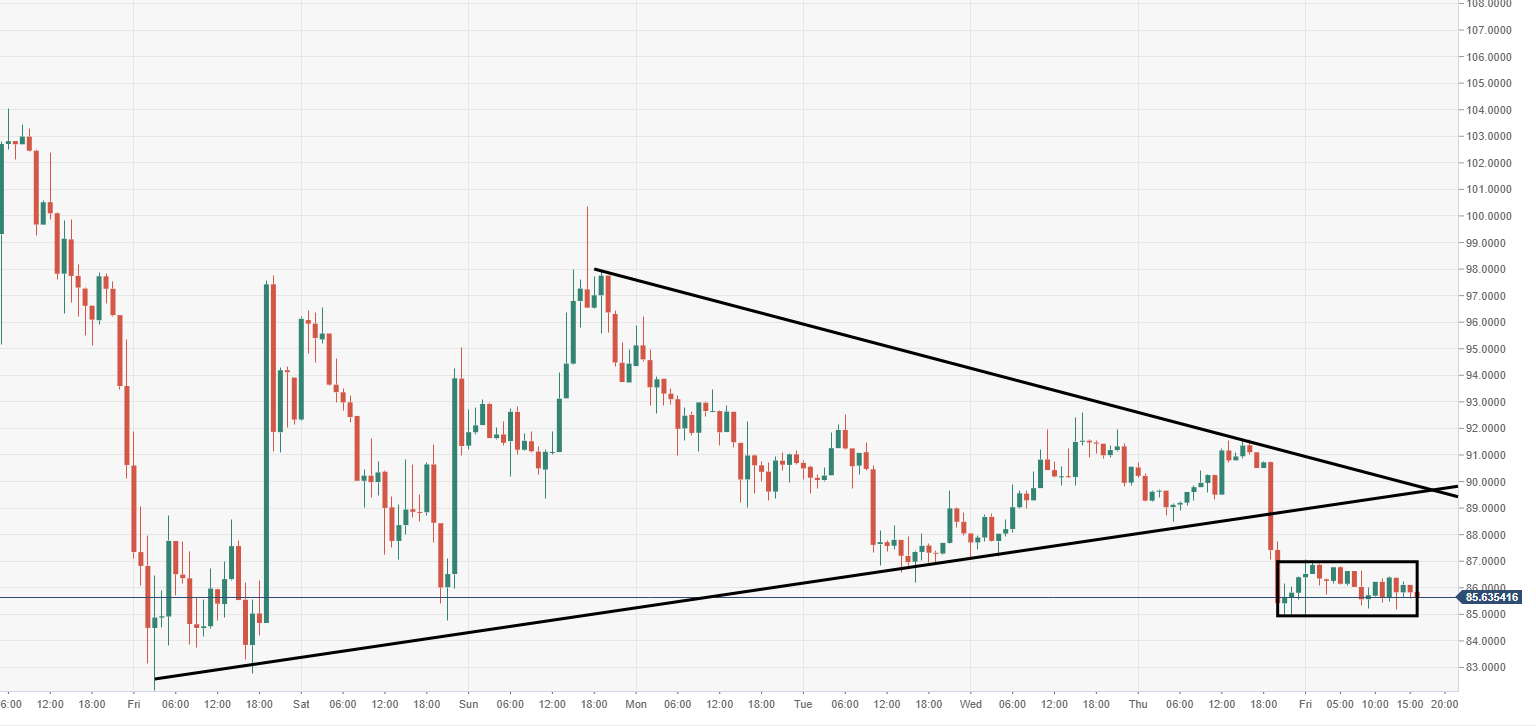
ETH/USD 60-minute chart
- Price action breached a triangular pattern during Thursday's session, inviting further downside pressure.
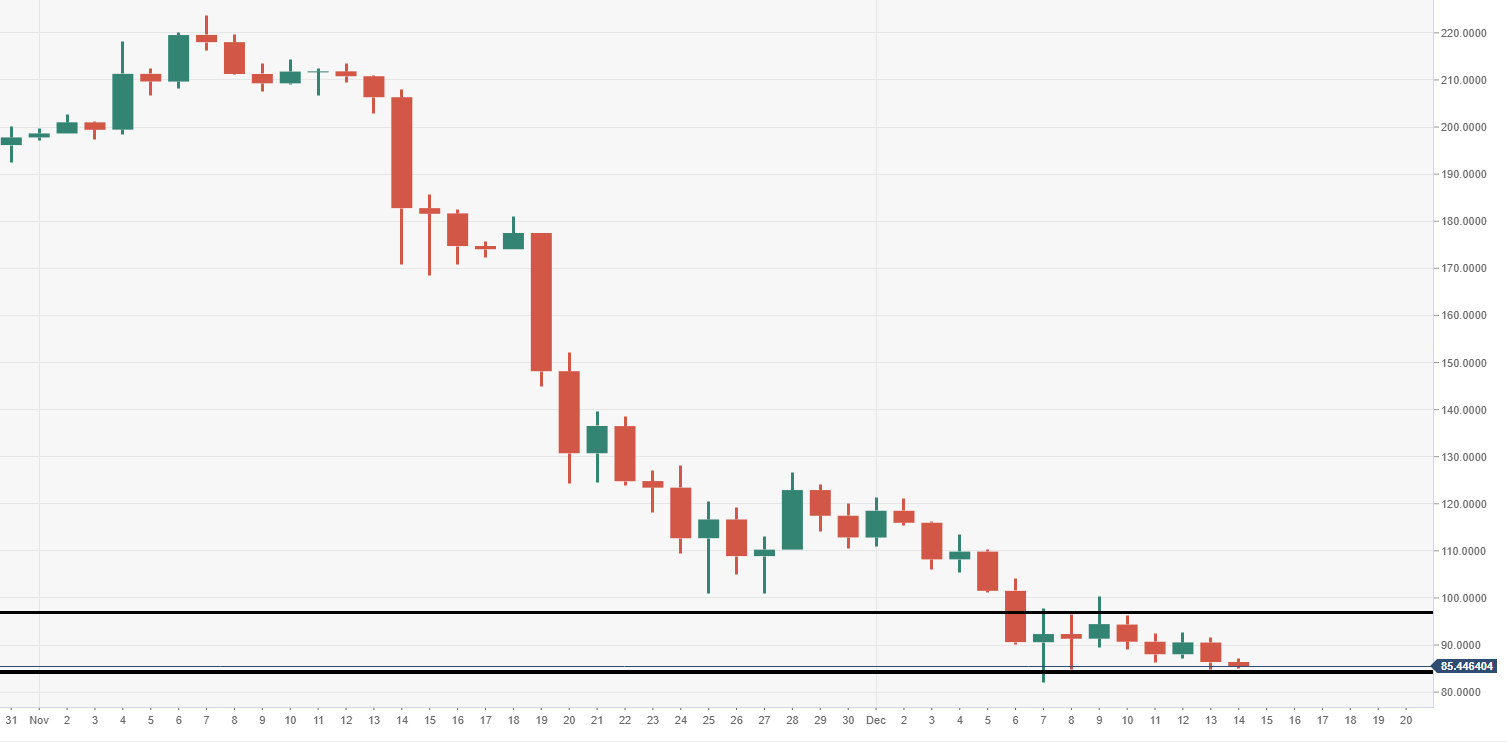
ETH/USD daily chart
- Key near-term support should be noted around the $83-81 price range, a break here could be devastating.
Author

Ken Chigbo
Independent Analyst
Ken has over 8 years exposure to the financial markets. He started his career as an analyst, covering a variety of asset classes; forex, fixed income, commodities and equities.


