Ethereum price prone to another leg up as Ether supply on exchanges plunges
- Ethereum price has been significantly weaker than Bitcoin, but that could change soon.
- The number of coins inside exchanges continues dropping at increasing rates.
- Similarly, the number of Ethereum locked inside Eth2 deposit contract has massively increased.

When it comes to market dominance, Bitcoin remains the clear winner jumping from a low of 57% on September 30 to a current peak at 69%. During the same time-frame, Ethereum’s dominance has dropped from 11.5% to 10.7%. However, things might be on the verge of changing
Ethereum price aiming for a rebound to $700
One of the best indicators of the potential of an asset’s price is the number of coins inside exchanges. This amount has dropped significantly over the past few months and it’s on the verge of touching a 2-year low at 22.43%.
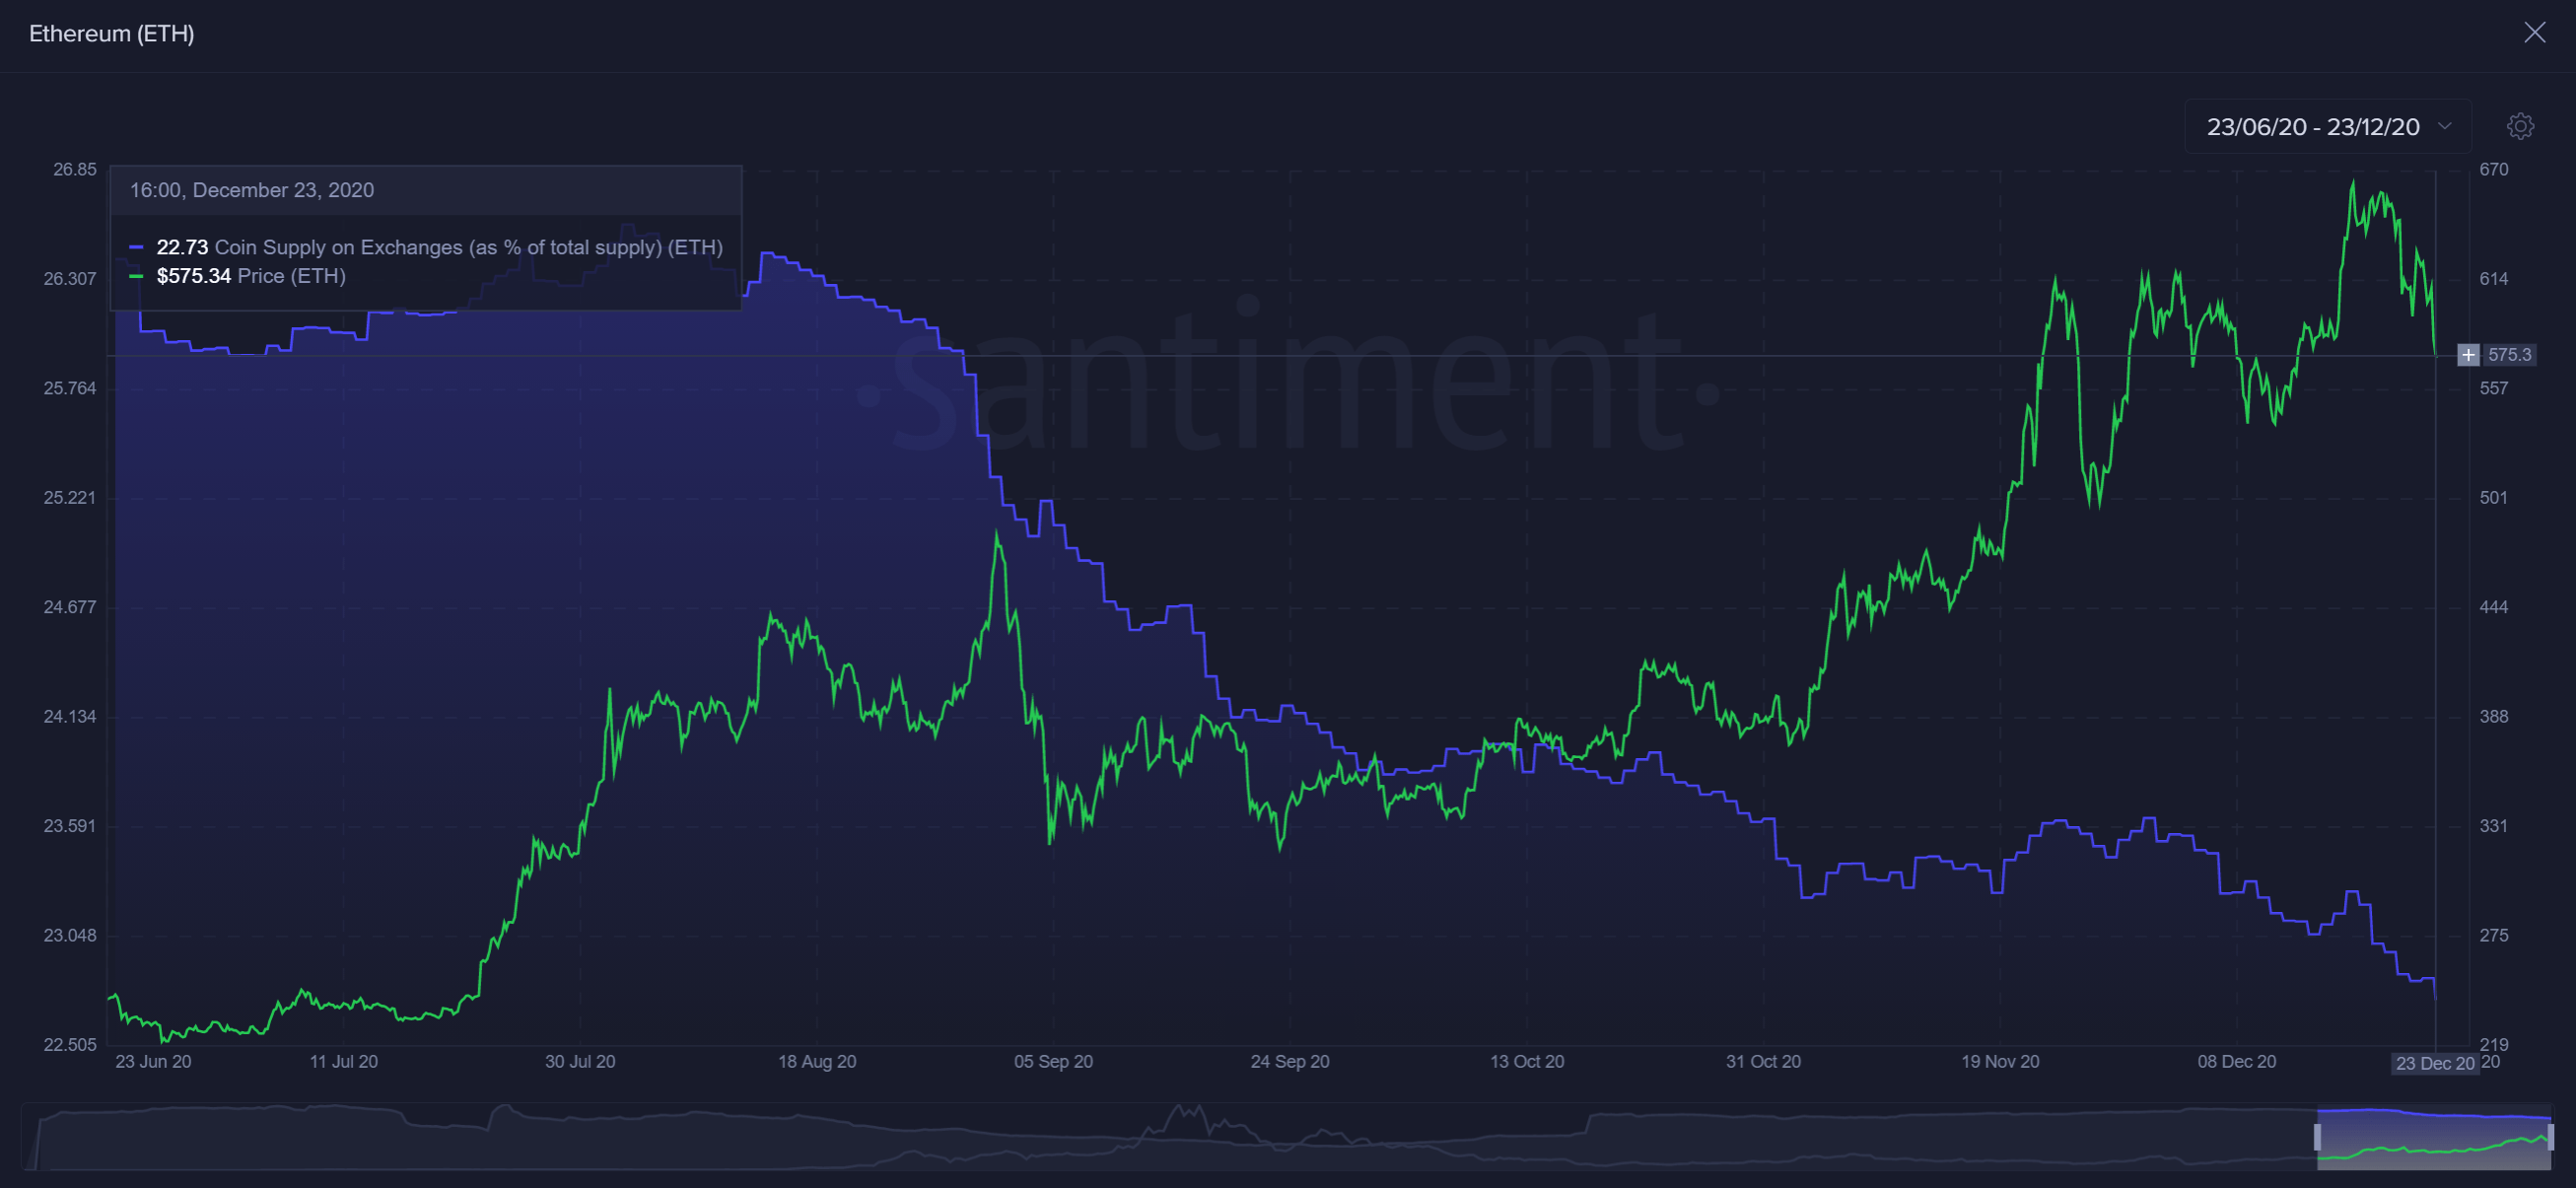
ETH Exchange Percentage of Supply on Exchanges chart
Perhaps, even more importantly, is the number of Ethereum coins deposited inside the Eth2 deposit contract. It has reached more than 2 million coins which are now locked and represent close to $1.2 billion at current prices. Both metrics show that investors are ready to hold Ethereum for long periods of time.
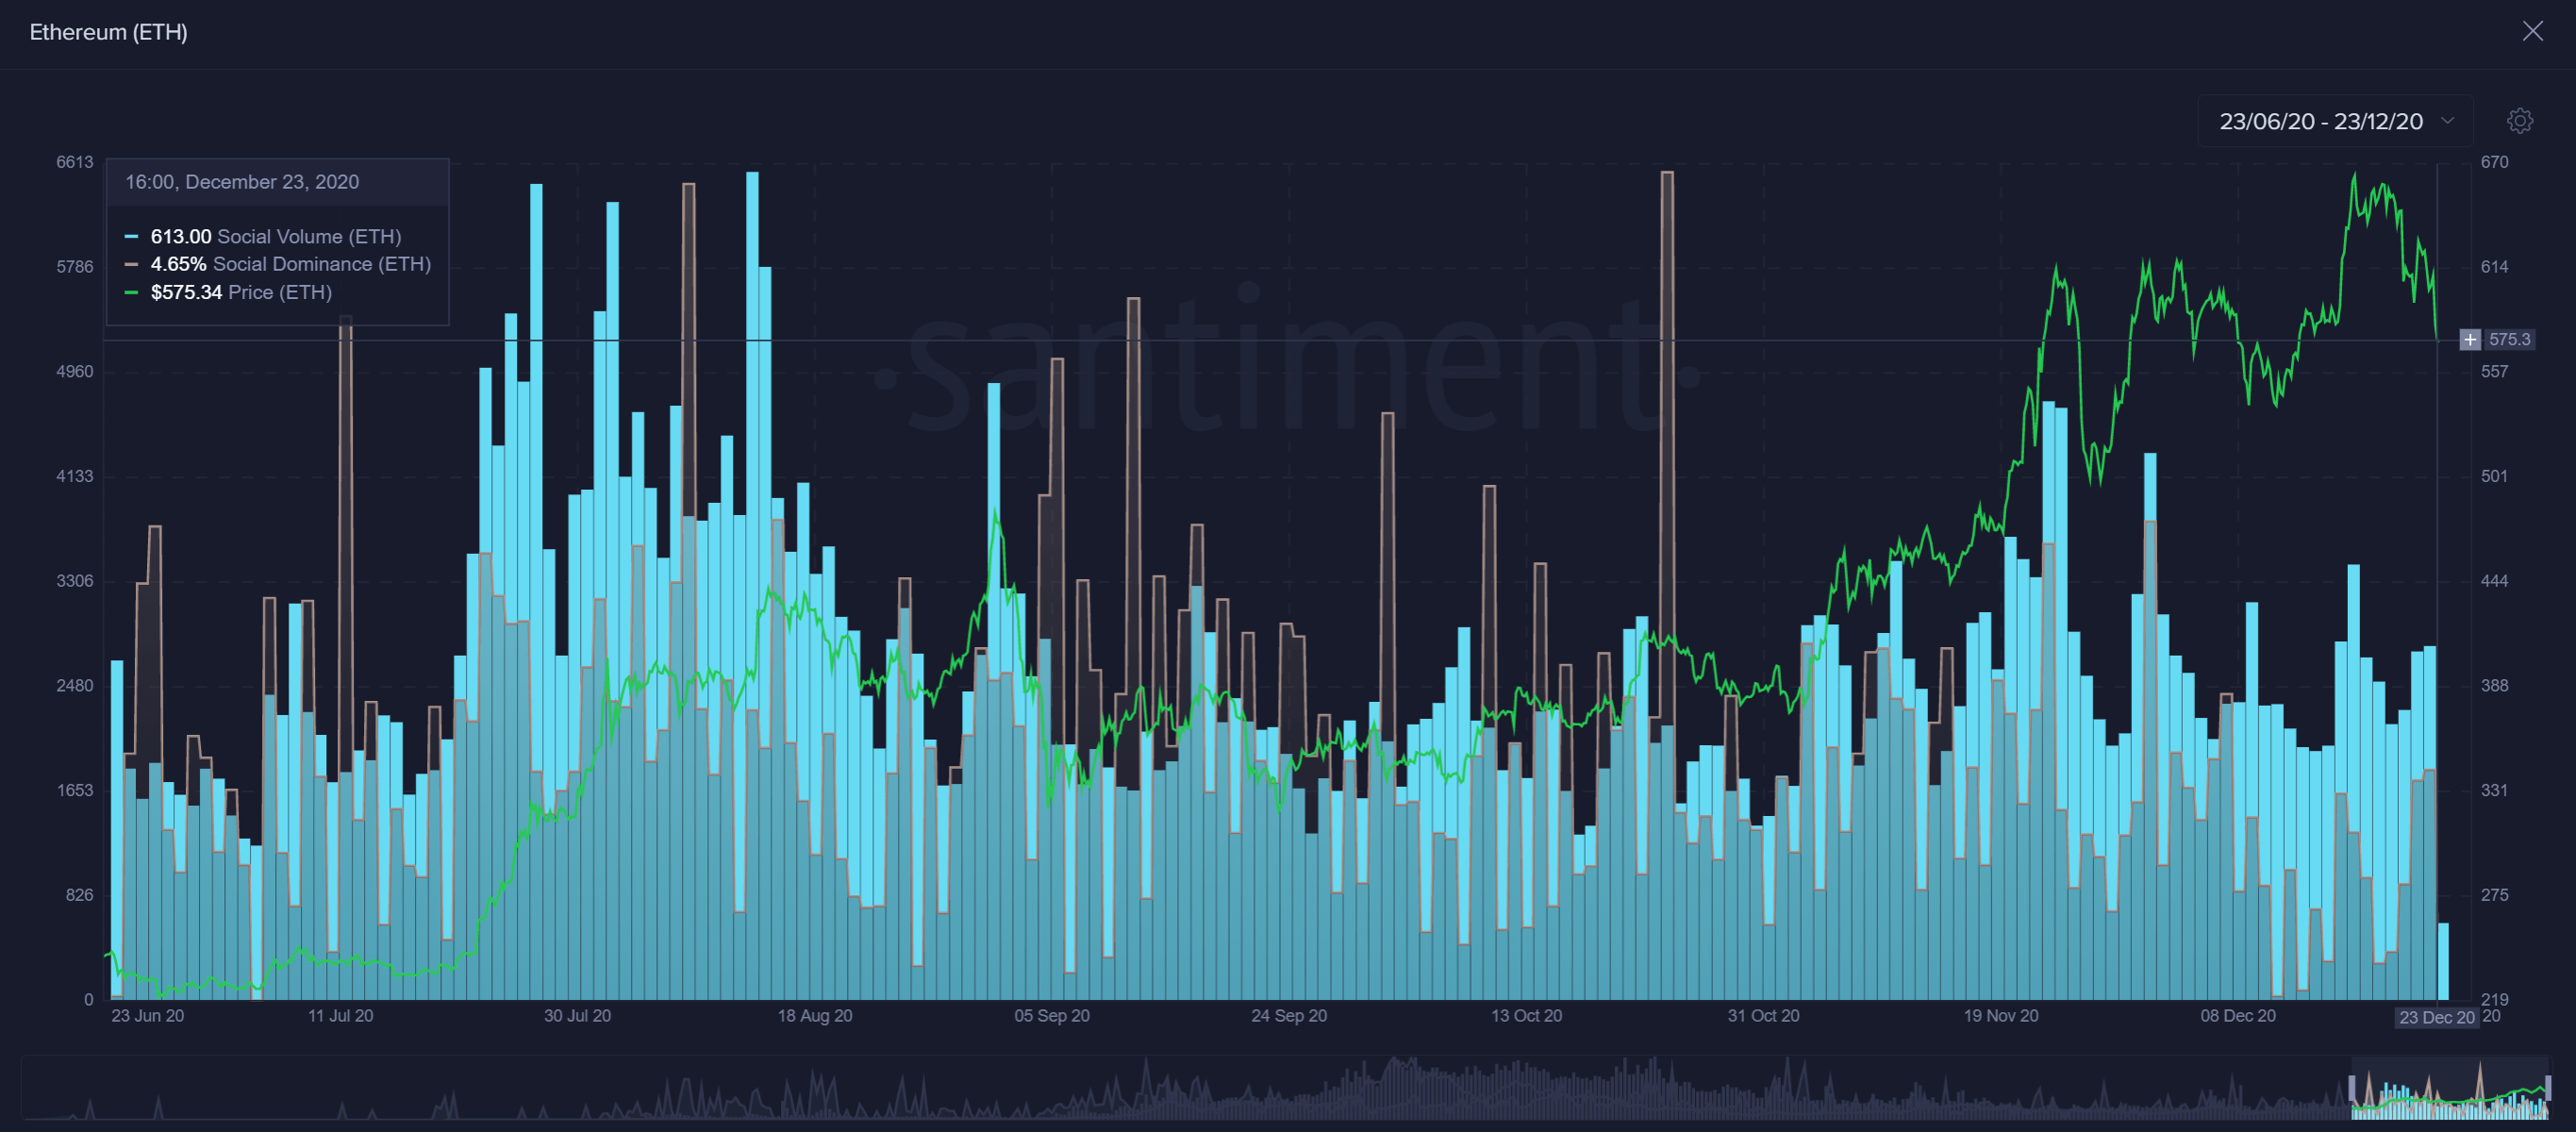
ETH Social Volume
It also seems that the social dominance of Ethereum has significantly dropped over the past few weeks, especially with Bitcoin rallying above $24,000 and Ripple being sued by the SEC. This is, in fact, a positive metric as it represents a good opportunity for new investors to jump in.
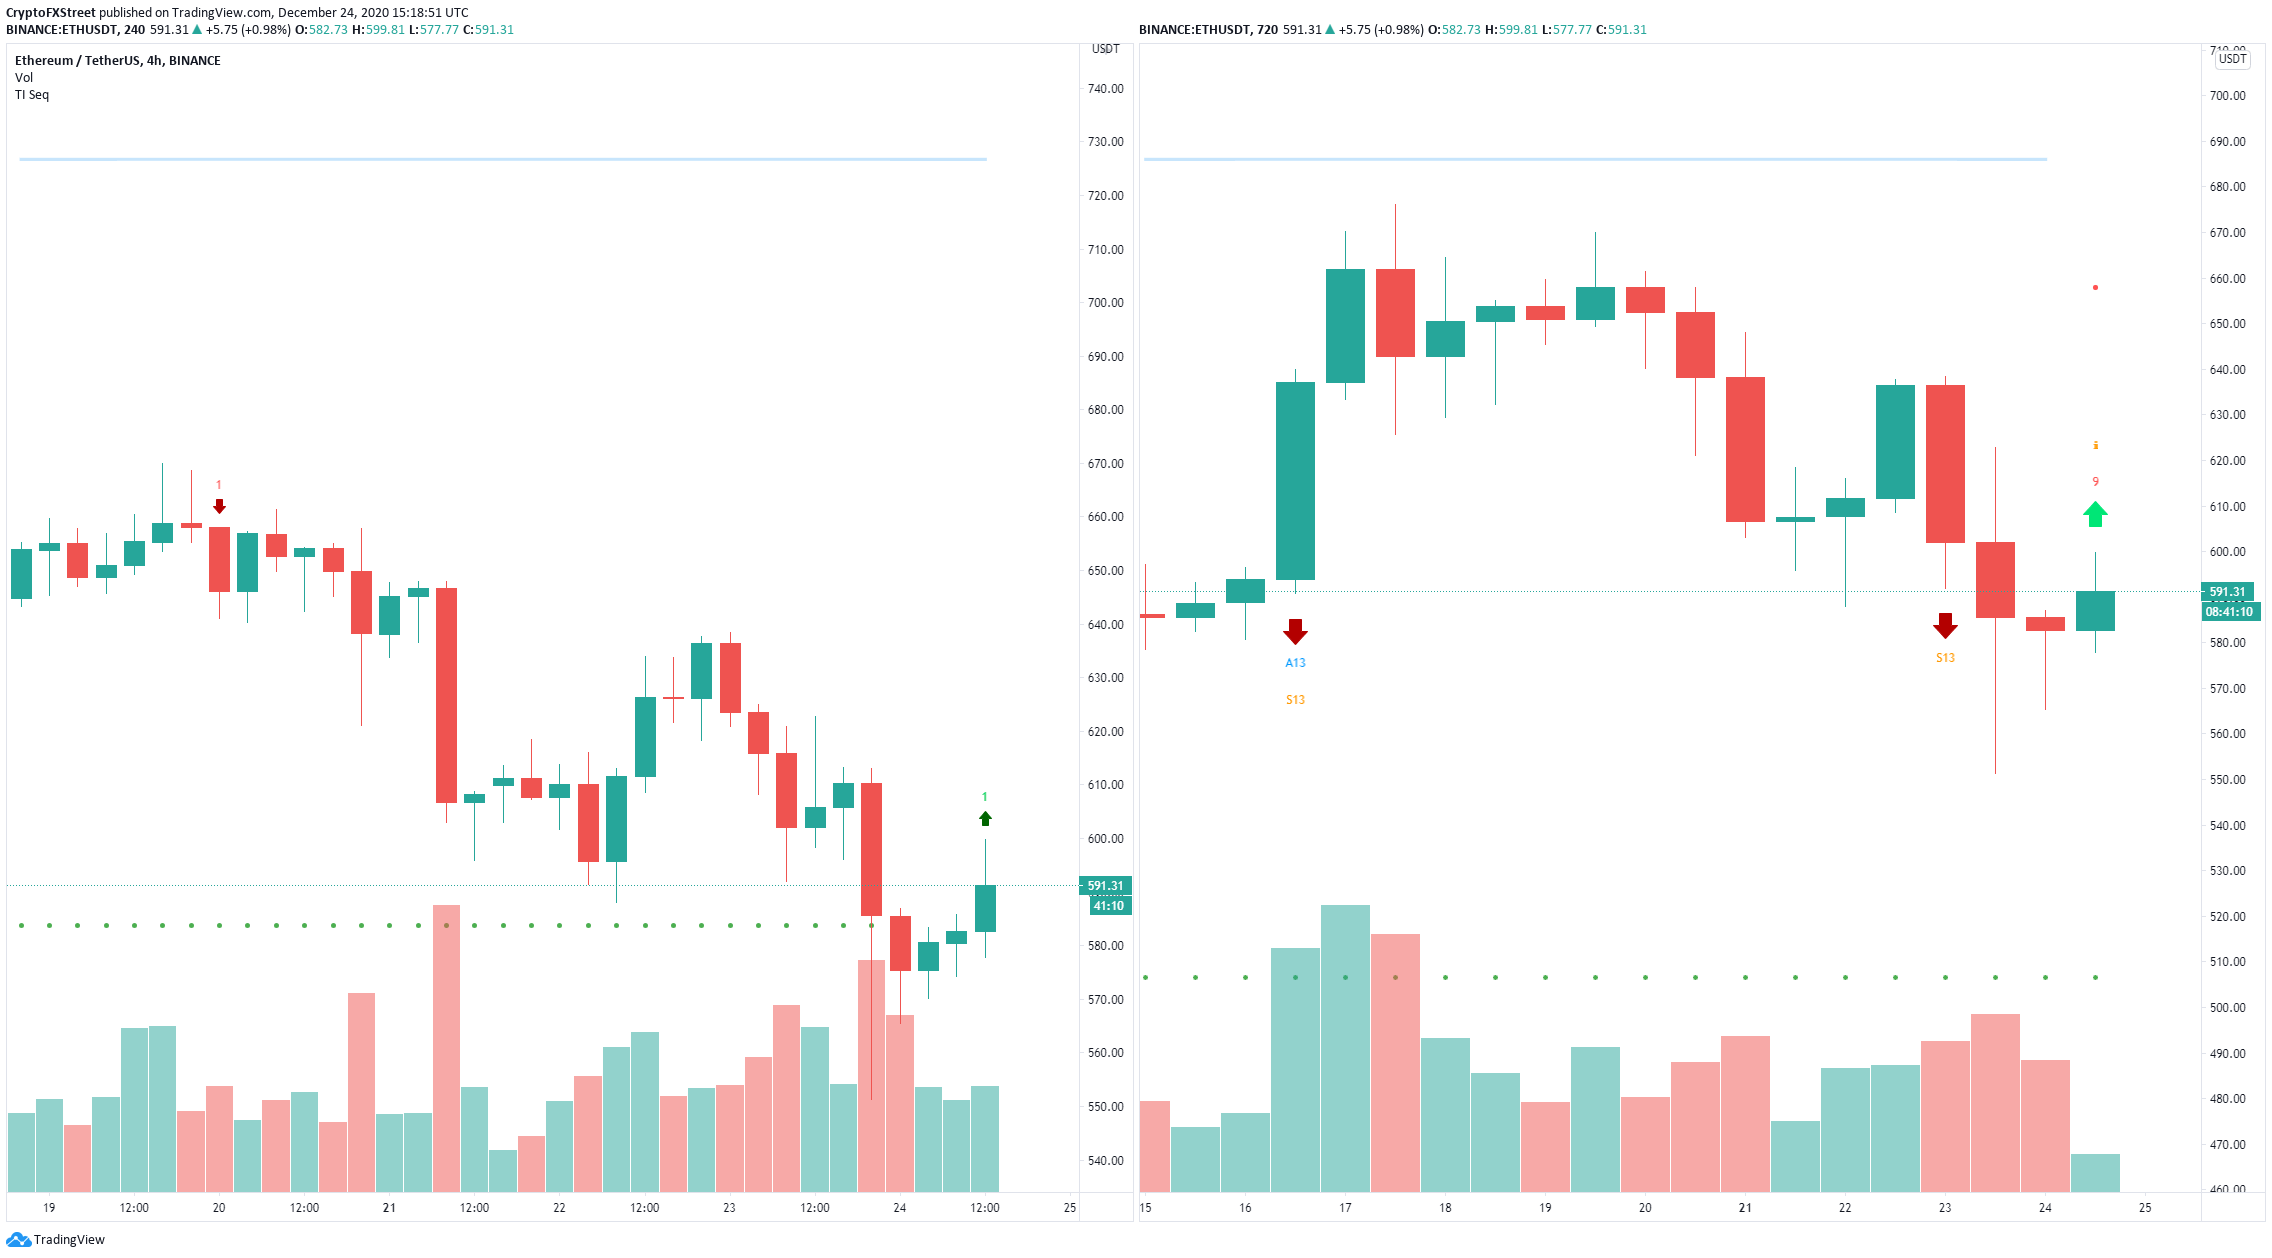
ETH/USD 4-hour and 12-hour chart
Additionally, the TD Sequential indicator presented buy signals on the 4-hour and 12-hour charts, adding even more credence to the bullish outlook.
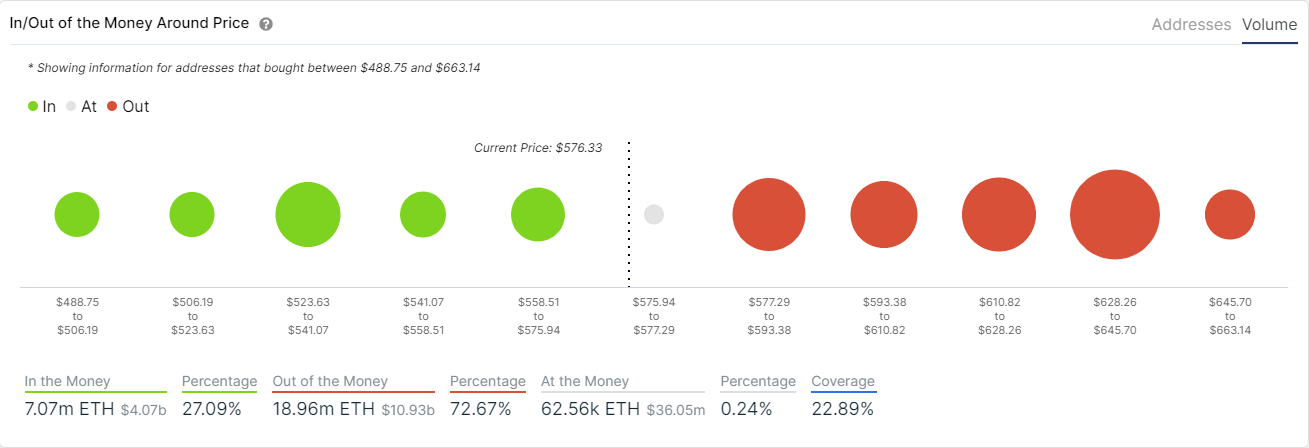
ETH IOMAP chart
Unfortunately, according to the In/Out of the Money Around Price (IOMAP) chart, there is steep resistance ahead, specifically between $628 and $645. A breakout above this point can quickly push Ethereum price towards $700.
However, failure to break this critical resistance area will most likely lead the digital asset into another correction. The IOMAP shows very little support on the way down. Bears could target a low of $500.
Author

Lorenzo Stroe
Independent Analyst
Lorenzo is an experienced Technical Analyst and Content Writer who has been working in the cryptocurrency industry since 2012. He also has a passion for trading.


