Ethereum Price Prediction: For how long will ETH/USD stay in consolidation? – Confluence Detector
- Ethereum price is deep in slumber ignoring the booming network activities such as DeFi.
- Ethereum price is unlikely to change direction in the near term as the RSI and MACD remain horizontal.

Ethereum, just like Bitcoin is in a lull with the price pivotal at $240 for a few days now. The motionless trading is taking place despite activities in the Ethereum network skyrocketing. For instance, last week the decentralized finance (DeFi) ecosystem hit a new all-time high after crossing the $2 billion mark.
Ethereum active addresses have also grown significantly since the beginning of this year. Not even the news regarding the impending launch of Ethereum 2.0 has been able to breathe fresh bullish air into the crypto.
At the time of writing, Ethereum is trading at $239. The second-largest cryptocurrency narrowed towards $240 after hitting a snag at $245. On the downside, immediate support is observed at the 200-day SMA. An ascending trendline has been key to the recovery witnessed since March when Ether tanked to $90.00.
The gap made by the 50-day SMA above the longer-term 200-day SMA suggests that Ethereum is mainly in the hands of the bulls but due to low volatility, the price is forced to stick to sideways trading.
Applied indicators such as the RSI and the MACD clearly show that bullish and bearish forces are canceling out. The RSI is holding the ground above 55 after retreating from levels above 60. Similarly, the MACD is clinging to the midline (0.00) with no signs of changing the direction anytime soon.
ETH/USD daily chart
 (58)-637302909610809568.png)
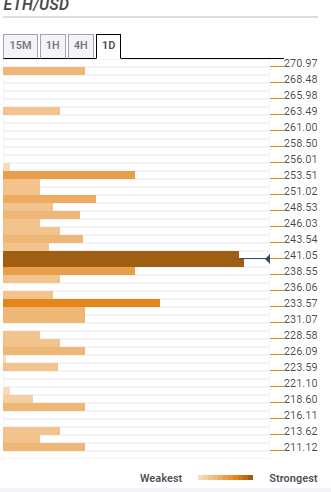
Ethereum confluence resistance and support levels
The first resistance which also happens to be a high seller congested zone lies at $241. A cluster of indicators converges here including the previous high 15-minutes, the SMA 50 1-hour, the Bollinger Band 15-minutes upper curve, the Fibonacci 38.2% one-day and the previous high 4-hour. The second key resistance is highlighted by the confluence tool at $253.51 and is home to the pivot point one-week resistance one and the previous month high.
On the flip side, $238.55 is the initial support. It is not as strong as the first support and is home to the previous low one-day, the Bollinger Band 1-hour lower, the previous low 4-hour and the previous low 1-hour. A second support area is highlighted at $233.57 and is home to the pivot point one-day support two, the SMA 100 4-hour and the BB 1-day weekly.
Author

John Isige
FXStreet
John Isige is a seasoned cryptocurrency journalist and markets analyst committed to delivering high-quality, actionable insights tailored to traders, investors, and crypto enthusiasts. He enjoys deep dives into emerging Web3 tren


