Ethereum Price Prediction: ETH/USD explodes past trendline resistance aiming for $240 – Confluence Detector
- Ethereum renews the bullish momentum supported mainly by the RSI and the MACD.
- ETH/USD is supported by a confluence of indicators at $231 and $229 respectively.

Ethereum is arguably the best performing digital asset among the major cryptocurrencies. It has opened the new week’s trading with impressive gains above the descending trendline as well as $230. Bitcoin and Ripple are slightly in the green. BTC is trading 0.8% higher on the day while teeters over 1% above the opening value.
Ether has stepped above the 38.2% Fibonacci level taken between the last swing high of $250.50 to a swing low of $218.08. In addition, the price is currently above the 50 SMA and looking forward to breaking the hurdle at the 50% Fibonacci level ($235).
The prevailing trend is in the hands of the bulls with the RSI moving closer to the overbought region. Another indicator, the MACD is almost crossing into the positive territory as a signal for a stronger technical picture. Gains above $235 must brace for a hurdle at the 100 SMA as well as $240. If the trend does not change, Ethereum could easily sail towards $250.
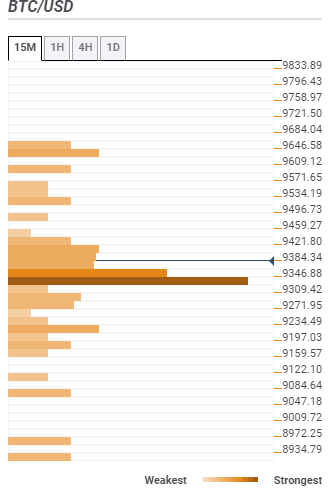
BTC/USD 4-hour chart
 (40)-637283917588577239.png)
Ethereum daily confluence levels
Resistance one: $233.99 – Highlights the pivot point one-day resistance two, the previous high 15-minutes, the previous high 1-hour and the Fibo 161.8% one-day.
Resistance two: $238.83 – Home to the previous week high and the pivot point one-week resistance one.
Support one: $231 – This is a strong support area highlighted by the Bollinger Band 4-hour upper curve, Bollinger band 1-hour upper curve, the SMA ten daily and the previous low 15-mins.
Support two: $229.15 – Hosts the SMA 50 15-minutes, the Fibo 61.8% one-day, the SMA 100 15-minutes and the Bollinger Band 4-hour middle.
Author

John Isige
FXStreet
John Isige is a seasoned cryptocurrency journalist and markets analyst committed to delivering high-quality, actionable insights tailored to traders, investors, and crypto enthusiasts. He enjoys deep dives into emerging Web3 tren


