- Ethereum bulls are struggling to build upon the support at $400 even as the hurdle at $410 stays put.
- A massive bearish cloud hovers over ETH/USD, especially with the formation of a bearish pennant pattern.
Ethereum appears to have found bearing above $400 following a devastating slump from highs close to $450. Tentative support at $430 and $420 failed to rise to the occasion following a BTC-triggered selloff on Wednesday. The largest cryptoasset tanked from levels above $12,200 and extended the free-fall to areas marginally above $11,500. Ether followed closely in Bitcoin’s footsteps, this time plunging slightly under $400.
ETH/USD has already made a shallow recovery above $400. However, the comeback above $400 is limited under $410. The daily chart brings into the picture a bearish pennant pattern that suggests that ETH is not yet done with the levels under $400.
Ethereum currently trading at $409, after sliding below the pennant pattern. Bulls need to work first and send the price above $410 resistance. This would allow them to shift attention back to $420 and $430 levels respectively, in turn, aiding in averting the potential declines that eye $350 on the downside.
For now, ETH seems to be slightly in the hands of the bulls and slightly in the hands of the bears. The RSI has held above the midline, encouraging buyers not to exit the market. On the flip side, the MACD is grinding lower towards the mean line. Moreover, a vivid bearish divergence from the MACD reinforces the bearish grip. It is essential that bulls defend the support as if their lives depend on it.
ETH/USD daily chart
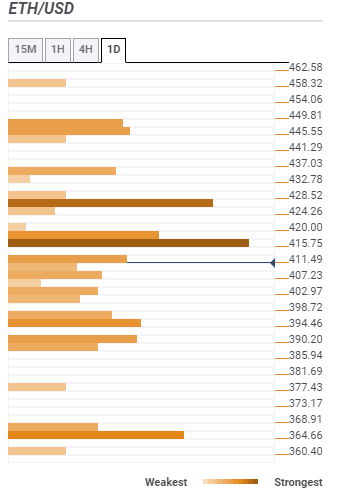
Ethereum confluence levels
Resistance one: $415 – This zone is home to the Fibo 61.8% one-day, Fibo 38.2% one-week, the Bollinger Band 15-minutes upper curve and the SMA ten 4-hour.
Resistance two: $420 – Highlighted by the SMA 200 15-minutes and SMA 50 one-hour.
Resistance three: $428 – Home to the pivot point one-day resistance one, the SMA five one-day and the Fibo 23.6% one-week.
Support one: $407 – As highlighted by the Bollinger Band 15-minutes lower curve, the Fibonacci 38.2% one-day and the previous low 1-hour.
Support two: $402 – The Bollinger Band 4-hour lower curve and the Fibonacci 23.6% one-day.
Support three: $390 – Highlighted by the pivot point one-month resistance one.
Information on these pages contains forward-looking statements that involve risks and uncertainties. Markets and instruments profiled on this page are for informational purposes only and should not in any way come across as a recommendation to buy or sell in these assets. You should do your own thorough research before making any investment decisions. FXStreet does not in any way guarantee that this information is free from mistakes, errors, or material misstatements. It also does not guarantee that this information is of a timely nature. Investing in Open Markets involves a great deal of risk, including the loss of all or a portion of your investment, as well as emotional distress. All risks, losses and costs associated with investing, including total loss of principal, are your responsibility. The views and opinions expressed in this article are those of the authors and do not necessarily reflect the official policy or position of FXStreet nor its advertisers. The author will not be held responsible for information that is found at the end of links posted on this page.
If not otherwise explicitly mentioned in the body of the article, at the time of writing, the author has no position in any stock mentioned in this article and no business relationship with any company mentioned. The author has not received compensation for writing this article, other than from FXStreet.
FXStreet and the author do not provide personalized recommendations. The author makes no representations as to the accuracy, completeness, or suitability of this information. FXStreet and the author will not be liable for any errors, omissions or any losses, injuries or damages arising from this information and its display or use. Errors and omissions excepted.
The author and FXStreet are not registered investment advisors and nothing in this article is intended to be investment advice.
Recommended Content
Editors’ Picks
Ripple's move above this key level could trigger nearly 50% rally for XRP
Ripple has overcome a critical resistance level and flipped into a support floor on the weekly time frame. This development happened while XRP tightly consolidated for roughly 250 days. Investors can expect XRP to kickstart a massive rally.
Optimism price outlook with nearly $90 million worth of OP tokens flooding markets on Friday
Optimism volatility has shrunk in the ours leading to the network’s cliff unlock. It joins the likes of dYdX and Sui, which have similar events on their calendars. As token unlocks are often considered bearish catalysts, investors should brace for a reaction after the event.
Top 3 Price Prediction Bitcoin, Ethereum, Ripple: Retail watches from the sidelines with a bias for shorts
Bitcoin could clear $73,777 peak as BTC bulls resurface. Ethereum might fall 10% before next leg up as ETH RSI teases with sell signal. XRP could lose $0.6000 threshold as Ripple bulls fail to show up.
Jito price could hit $6 as JTO coils up inside this bullish pattern
Jito price action shows a potential cup and handle formation. Based on theoretical measurement rules, a successful breakout could yield a 56% rally to $6.0. A breakdown of the $3.86 support level would create a lower low for JTO and invalidate the bullish thesis.
Bitcoin: BTC may have recovered, but is it out of the woods?
Bitcoin’s (BTC) upward momentum has shown a significant decline for the past two weeks or so. This development led to a bearish signal on the weekly and an uncertain outlook on the monthly.