Ethereum Price Prediction: ETH runs risk of sliding 14% as crypto market weakens [Video]
- Ethereum price slid below two critical levels of defense as the bears kickstarted a sell-off.
- A 14% decline toward $2,452 is put on the radar, given by the prevailing chart pattern.
- The bulls would need to reclaim $2,870 as support to reverse the period of underperformance.
![Ethereum Price Prediction: ETH runs risk of sliding 14% as crypto market weakens [Video]](https://editorial.fxstreet.com/images/Markets/Currencies/Cryptocurrencies/Coins/Ethereum/ethereum.jpg)
Ethereum price has dropped below two significant footholds on January 21, as selling pressure increased. ETH could be at risk of declining an additional 14%, a pessimistic forecast given by the bearish chart pattern.
Ethereum price loses two critical support levels
Ethereum price broke below the multi-month support trend line that formed since September 21 at $2,959. The spike in buy orders has also pushed ETH below the lower boundary of the descending parallel channel on the 4-hour chart located at $2,870, suggesting that ETH could put a 14% decline on the radar, toward $2,452.
The Arms Index (TRIN) which gauges overall market sentiment suggests that there is an uptick of sellers in the market, indicating some investors are panicking, leading to a sell-off.
The first line of defense for Ethereum price is at the September 28 low at $2,782. An additional foothold may emerge at the 127.2% Fibonacci extension level at $2,652, coinciding with the September 21 low.
Ethereum price may discover another line of support at the July 24 high at $2,553 before ETH plunges toward the downside trend line of the lower parallel channel, a bearish projection given by the prevailing chart pattern at $2,452, coinciding with the 161.8% Fibonacci extension level.
However, if buying pressure increases, the first line of resistance is at the lower boundary of the prevailing chart pattern at $2,870, then at the 78.6% Fibonacci retracement level at $2,933.
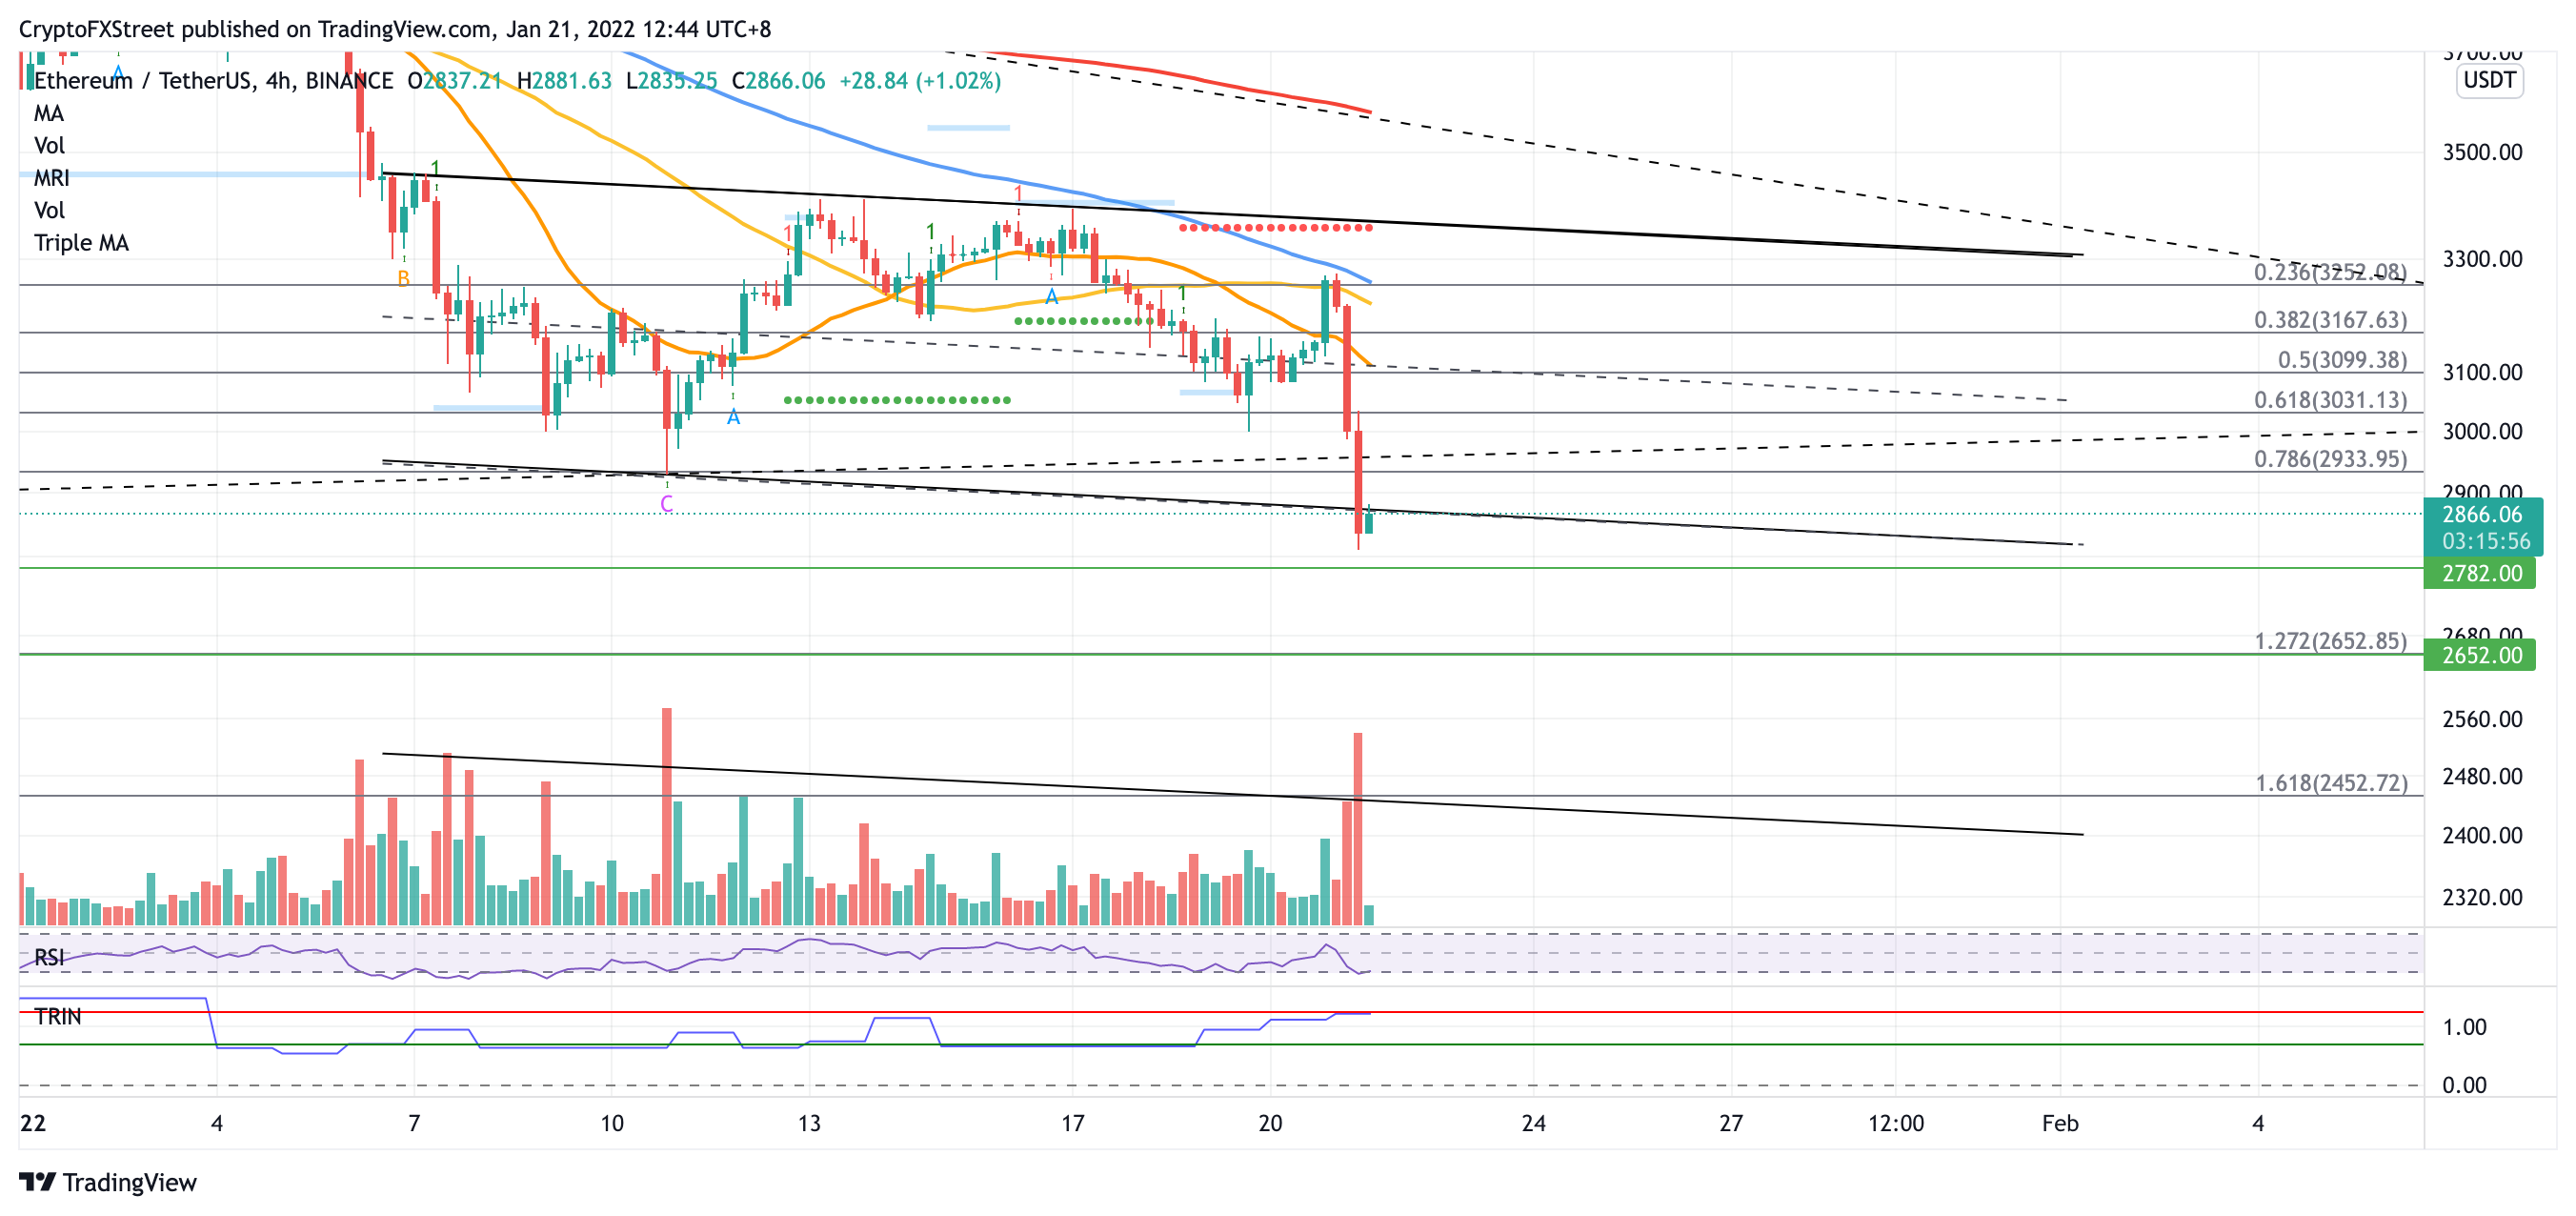
ETH/USDT 4-hour chart
Additional obstacles may appear at the 61.8% Fibonacci retracement level at $3,031, then at the 50% retracement level at $3,099 which coincides with the middle boundary of the governing technical pattern and the 21 four-hour Simple Moving Average (SMA).
Buyers will struggle to lift prices higher above $3,167, where the 38.2% Fibonacci retracement level sits, and at the 23.6% Fibonacci retracement level at $3,252, intersecting with the 100 four-hour SMA.
Author

Sarah Tran
Independent Analyst
Sarah has closely followed the growth of blockchain technology and its adoption since 2016.


