Ethereum Price Forecast: ETH surpassed key milestones in June, but price remains muted

Ethereum price today: $2,400
- Ethereum ends June with negative returns, failing to react to several bullish catalysts, including strong ETF and accumulation address inflows.
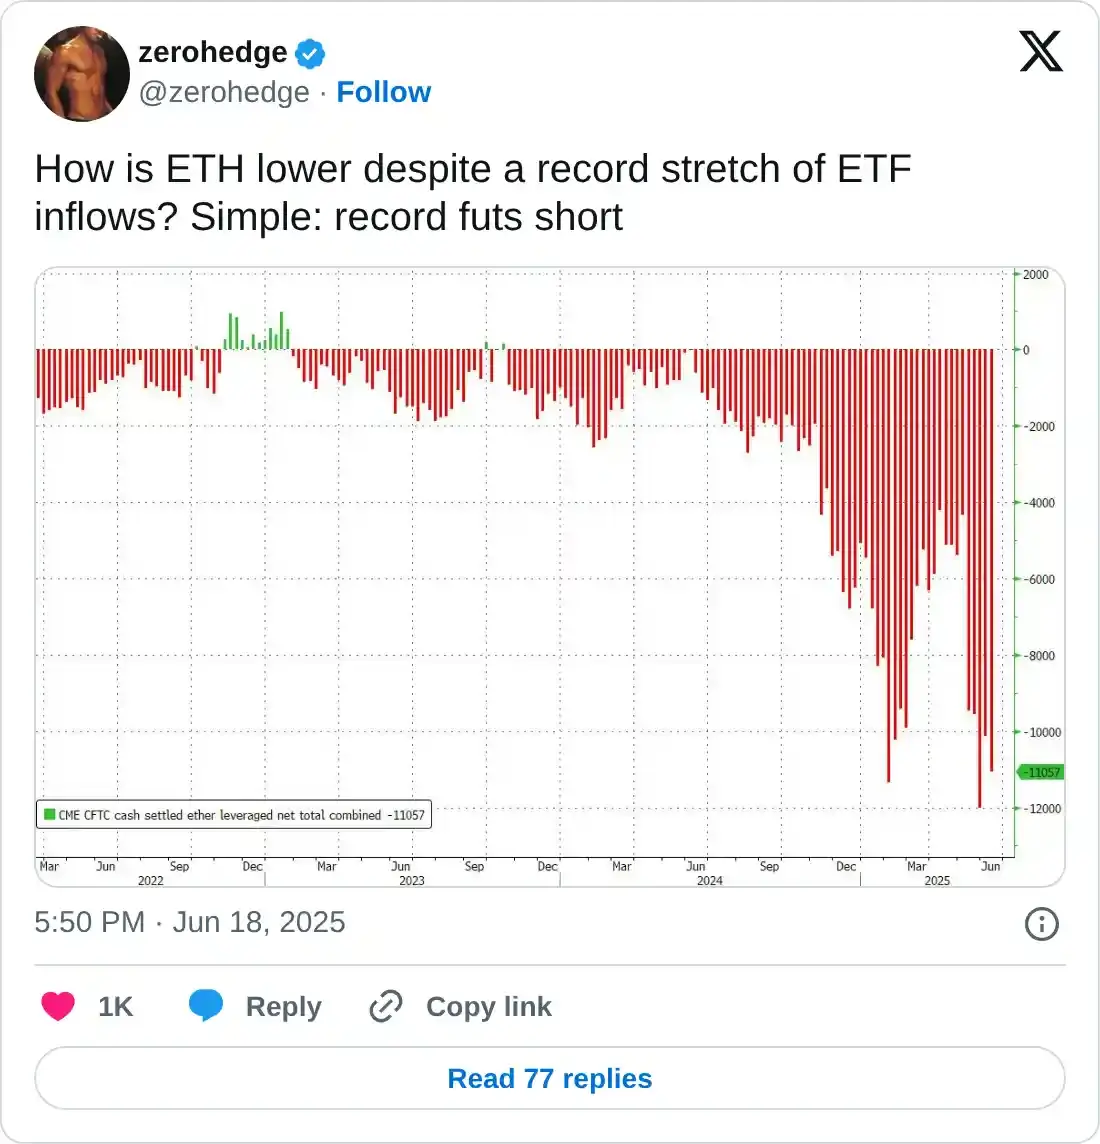
- Geopolitical tensions and record CME shorts on ETH played a key role in keeping prices stagnant.
- ETH has posted a bearish cross on the 12-hour chart after seeing a rejection near the $2,500 key level.
Ethereum (ETH) is down 3% on Tuesday, extending its decline from June, which ended on a negative note despite key bullish catalysts in the month, including high exchange-traded funds (ETFs) inflows, record-breaking buying from accumulation addresses, and public companies launching ETH treasuries.
Why ETH failed to rally in June amid major bullish developments
Ethereum ended June with a 1.5% decline, pushing its H1 performance to a 25% loss despite marking several major milestones in the month, according to Cryptorank data.
In June, US spot Ethereum ETFs marked their second-best month since launch, recording $1.16 billion in net inflows and only three trading days of outflows totaling $39.98 million — its lowest monthly outflow volume on record.
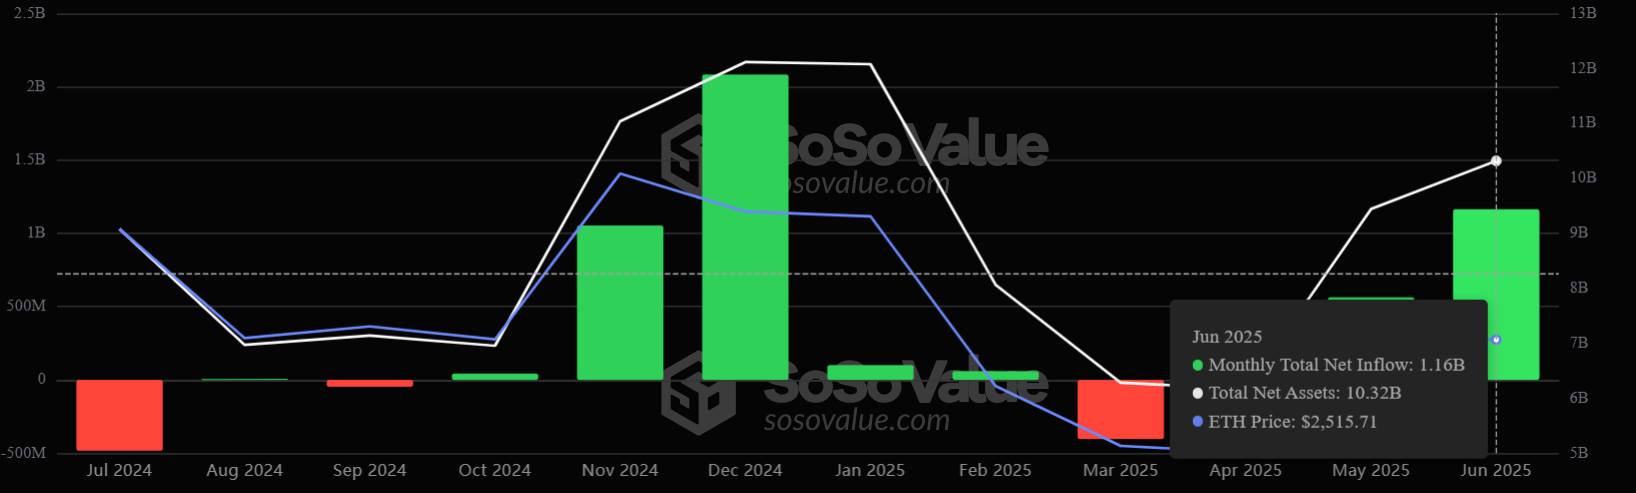
ETH ETF Flows. Source: SoSoValue
On top of that, June also marked the strongest monthly inflow into ETH accumulation addresses in history, as visible in the chart below, indicating high demand. Accumulation addresses — often dominated by new wallets — are addresses that have never recorded any outflows or selling activity.
-1751404109315.png)
ETH Accumulation Addresses. Source: CryptoQuant
The month also saw several public companies, including SharpLink Gaming (SBET), Bit Digital (BTBT), and BitMine (BMNR), launching ETH treasury strategies. Coupled with these, the total value of staked ETH on Ethereum grew steadily to a new all-time high of 35.52 million ETH.
In addition, the GENIUS stablecoin bill passed the US Senate with bipartisan support, boosting sentiment around the Ethereum blockchain as it commands nearly 50% of the stablecoin market, per DefiLlama data.
Ethereum failed to sustain an uptrend even with these bullish catalysts, which spur price growth on normal occasions.
Some potential reasons for the range-bound movement in ETH amid the bullish developments include geopolitical tensions casting a shadow on the entire crypto market. Ignited by Israel-Iran nuclear attacks, ETH lost key support levels, briefly crashing to $2,110, offsetting days of underlying mounting bullish structure.
ETH also reacted negatively to Tesla CEO Elon Musk and President Trump's clash on the social media platform X over the One Big Beautiful Bill in June. At the time of publication, ETH saw a 3% decline on Tuesday, with tensions between Musk and Trump heating up again after the bill passed the Senate.
Additionally, investors appear to be expanding the ETH basis trade with short positions on the CME growing alongside inflows into ETH ETFs.
Meanwhile, smart wallet tracker EmberCN also noticed a key whale/institution withdrew 95.3K ETH from staking over the past three weeks, sending 68.1K ETH from the amount to exchanges for potentially selling.
Ethereum Price Forecast: Bearish cross in play after ETH rejection at $2,510
Ethereum saw $46.06 million in futures liquidations in the past 24 hours, according to Coinglass data. The total amount of long and short liquidations is $40.10 million and $5.96 million, respectively.
ETH extended its consolidation in the $2,300-$2,500 tight range on Monday after seeing a rejection near the $2,510 key level, which bears have defended over the past week.
Just above $2,510, the 50-period Simple Moving Average (SMA) has crossed below the 100-period SMA, implying a death cross signal in the short term. The death cross is a lagging indicator that shows the short-term price momentum is weaker than that of the long term.
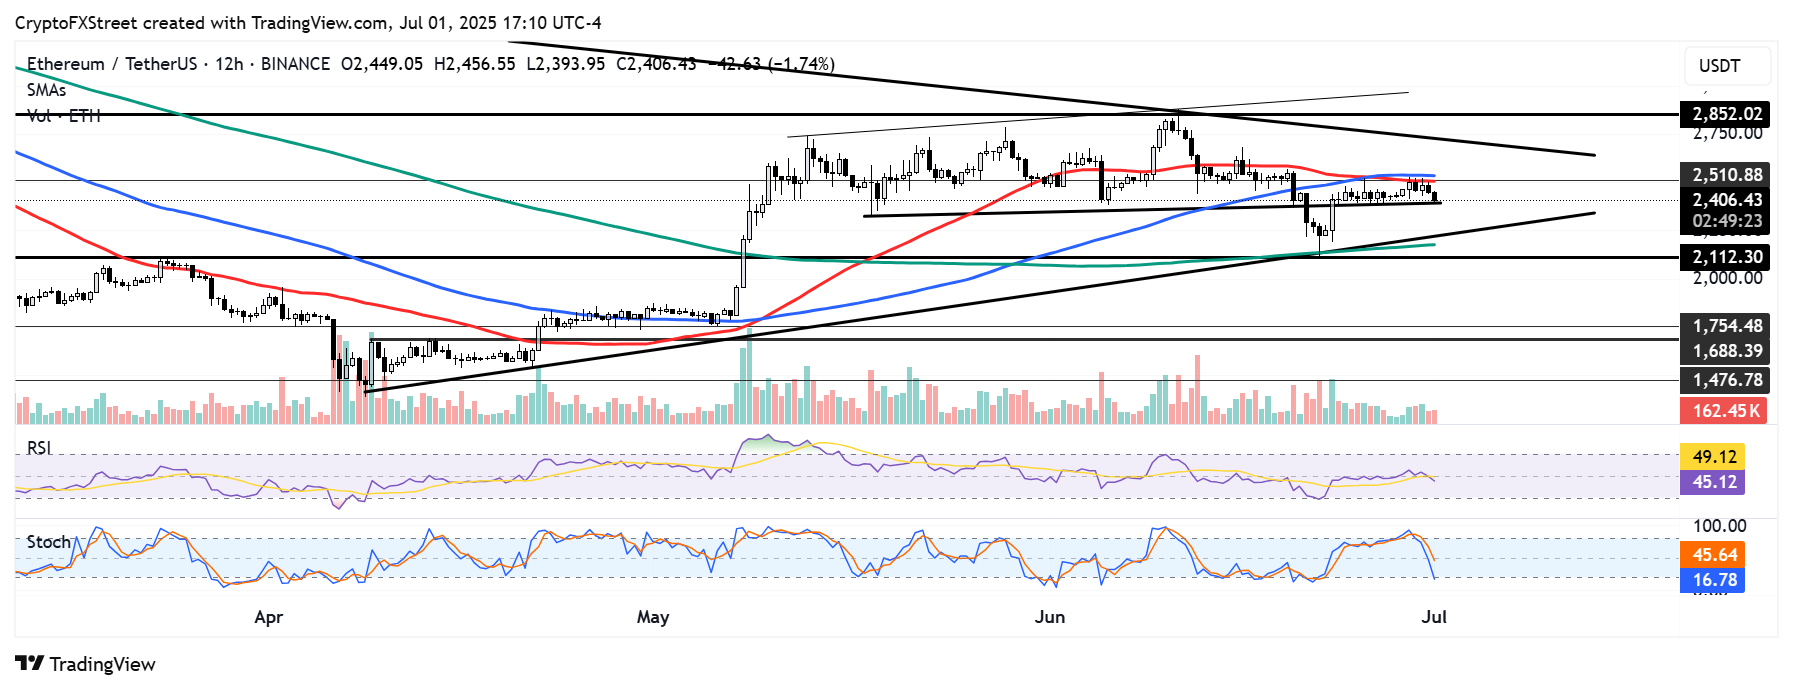
ETH/USDT 12-hour chart
With this signal in play, if ETH fails to hold the support line near $2,350, it could bounce off the lower boundary line of a symmetrical triangle pattern, strengthened by the 200-period SMA. However, a subsequent decline below these key levels and the $2,110 support could send ETH plunging toward $1,750.
On the upside, ETH has to overcome the resistance near the 50-period and 100-period SMA to retest the symmetrical triangle upper boundary.
The Relative Strength Index (RSI) is range-bound near its neutral level, while the Stochastic Oscillator (Stoch) has declined toward its oversold region, indicating a growing bearish momentum.
Author

Michael Ebiekutan
FXStreet
With a deep passion for web3 technology, he's collaborated with industry-leading brands like Mara, ITAK, and FXStreet in delivering groundbreaking reports on web3's transformative potential across diverse sectors. In addition to


