Ethereum Price Forecast: ETH freefall looms in the wake of rejection under $1,900
- Ethereum bears swing into action as sell signals sprout across the board.
- The TD Sequential indicator has presented a sell signal on the 12-hour chart.
- A rising wedge pattern points to a seemingly imminent breakdown in the near-term.
- The MACD indicator could save the bulls from the downswing if the bullish impulse holds.

Ethereum is trading at $1,780 following a recent rejection from levels slightly under $1,900. The correction is dimming the investors' hope that Ether will hit $2,000 in the short-term. Meanwhile, both on-chain and technical levels suggest that Ether is about to take a trip downstream.
Ethereum prints a massive bearish pattern
The 12-hour chart illustrates the formation of a rising wedge. It is a bearish pattern that tends to form in the middle of an uptrend. A rising wedge helps traders identify instances when the asset's uptrend is weakening. Simultaneously, bears are preparing to take control of the joystick. A breakdown equal to the height of the wedge's back is expected when the price slices through the lower trendline.
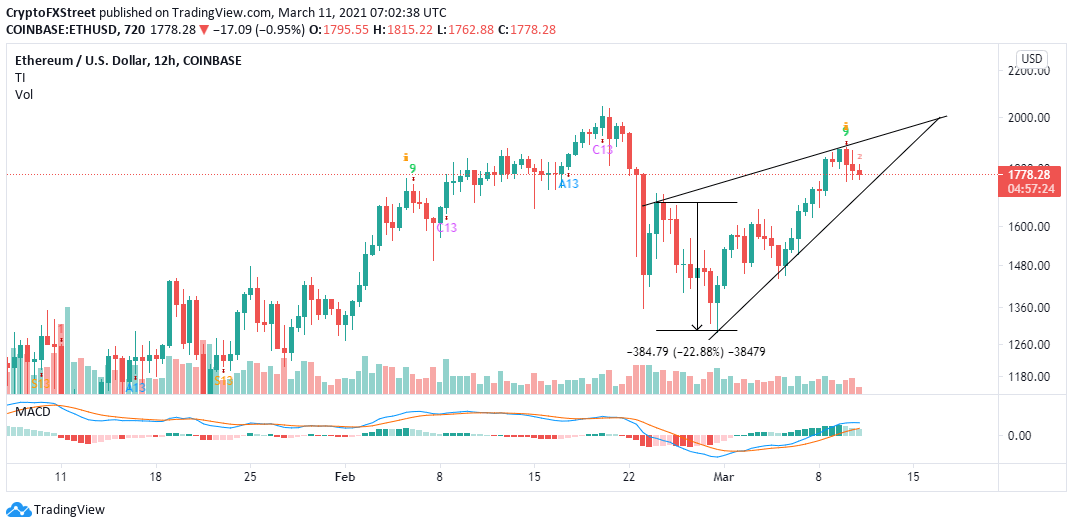
ETH/USD 12-hour chart
The TD Sequential indicator has recently presented a bearish signal. The call to sell formed in a red nine candlestick and confirms the weakening uptrend. If validated, Ethereum could fall in one to four 12-hour candles.
According to Santiment's on-chain data, Ethereum is setting the pace for a downswing. For example, the MVRV has started to retreat after hitting 10.9%, the highest point in March. The MVRV measures the average profit or loss of the holders of ETH tokens that were transacted over the previous 30-days and based on the price when each of those tokens last moved.
An MVRV value higher than one means holders are in profit and are likely to sell. On the flip side, a value of zero or less shows investors are at a loss and unlikely to sell. With an MVRV above 10%, Ethereum is bound for a retreat.
%20[10.12.08,%2011%20Mar,%202021]-637510449654445180.png)
Ethereum MVRV model
Ethereum's network growth has also been on a downward spiral, according to Santiment. The Network growth metric reveals a significant decline in the number of addresses joining the network daily.
Newly-created addresses made a monthly high of approximately 178,000 on February 20. At the time of writing, these addresses stand at roughly 144,400, representing a 19.1% drop. Declining network growth is a bearish signal and shows that the network is losing traction with time.
%20[10.20.10,%2011%20Mar,%202021]-637510449747240499.png)
Ethereum network growth
Looking at the other side of the picture
Ethereum may invalidate the downtrend if the Moving Average Convergence Divergence (MACD) holds above the mean line. Moreover, the MACD line (blue) must hold on top of the signal line to ensure market stability. Action past $1,800 would also trigger massive buy orders as investors speculate Ether rising above $2,000.
Author

John Isige
FXStreet
John Isige is a seasoned cryptocurrency journalist and markets analyst committed to delivering high-quality, actionable insights tailored to traders, investors, and crypto enthusiasts. He enjoys deep dives into emerging Web3 tren


