Ethereum Price Forecast: ETH aims for a quick run-up to $1,900 if vital support holds
- Ethereum price has been trading inside an ascending wedge pattern since the beginning of 2021.
- It seems that bulls have once again defended a key support level and aim for a rebound.
- The amount of Ethereum coins locked away from exchanges continues to rise.

Ethereum hit a new all-time high at $1,871 on February 13 and after a brief correction, it looks ready for another leg up as long as ETH bulls can hold a key support level. It seems that large investors have continued to accumulate even more Ethereum despite the new all-time highs.
Ethereum price is ready for a jump towards $1,900
On the 12-hour chart, Ethereum has been trading inside an ascending wedge pattern since the beginning of 2021. On February 15, ETH defended the lower boundary of the pattern again and is now trying to rebound from the 26-EMA support level.
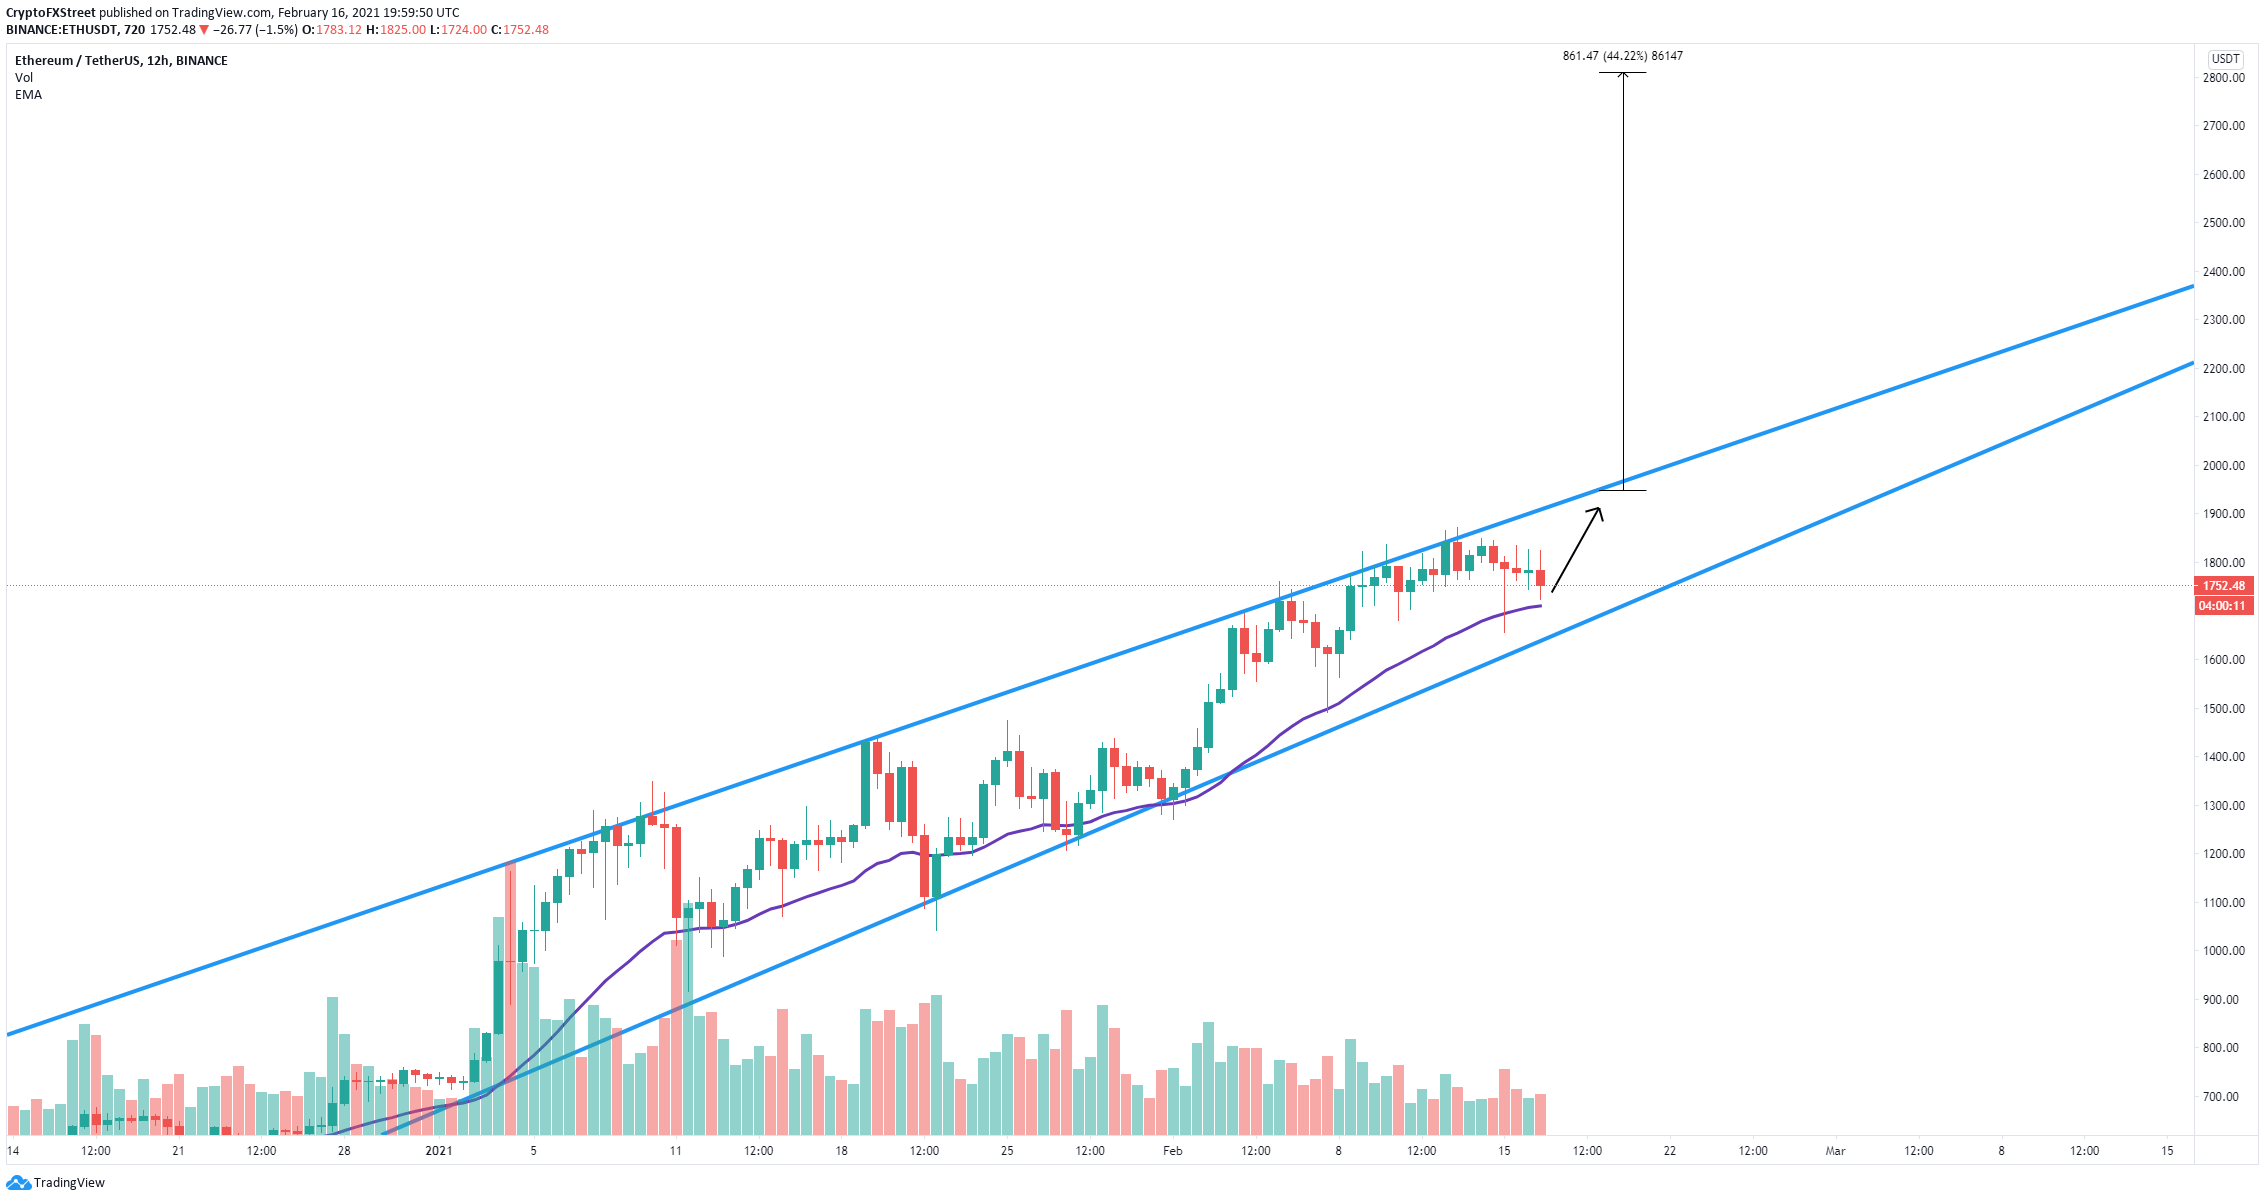
ETH/USD 12-hour chart
A close above the 26-EMA can quickly push Ethereum price towards the upper boundary of the channel again at $1,900, keeping in mind that a breakout above the upper trendline would drive Ethereum price towards a high of $2,800.
The Eth2 deposit contract now holds 3.1 million Ethereum worth around $5.44 billion at the time of writing. Additionally, there are 7.68 million Ethereum locked inside different DeFi protocols which means that 10.78 million ETH are locked away from exchanges, worth over $18.7 billion. This represents about 10% of the circulating supply of Ethereum.
%20[21.04.10,%2016%20Feb,%202021]-637491029956181988.png)
ETH Holders Distribution chart
Additionally, since the beginning of 2021, the number of large holders has increased significantly for Ethereum. The amount of whales with at least 1,000,000 coins and 10,000,000 at most ($1,700,000,000 and $17,000,000,000) has increased two. Similarly, holders with 100,000 - 1,000,000 ETH also went into a buying spree from 152 on December 31, 2020, to 159 currently.
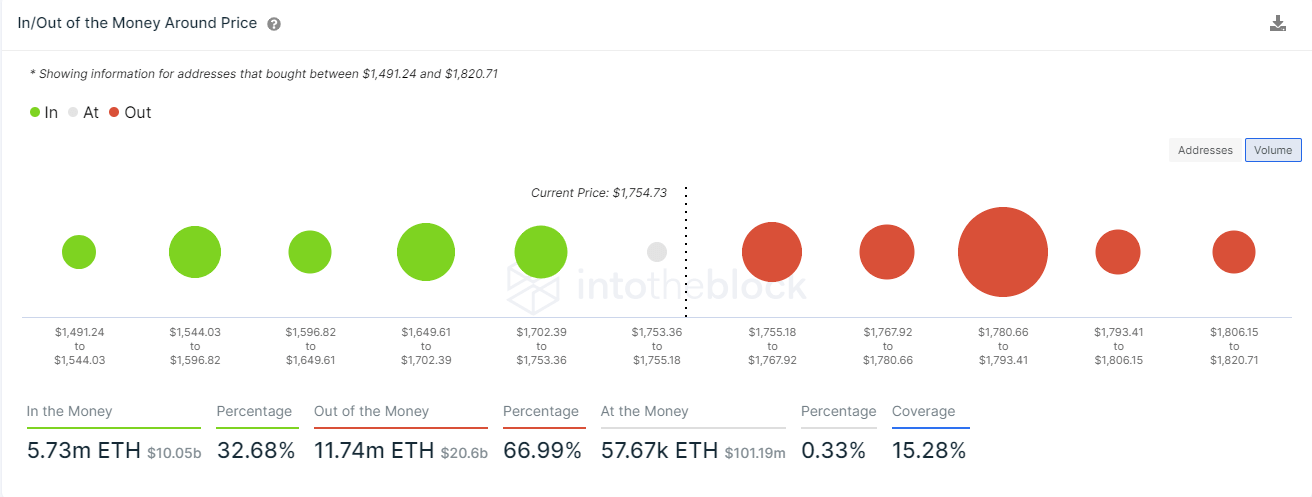
ETH IOMAP chart
The In/Out of the Money Around Price chart shows one critical resistance area between $1,780 and $1,793. Climbing above this range will give a lot of credence to the bullish outlook. However, the IOMAP also shows weak support on the way down.
Losing the 26-EMA support level on the 12-hour chart can quickly result in a drop towards the lower boundary of the ascending wedge at $1,660.
Author

Lorenzo Stroe
Independent Analyst
Lorenzo is an experienced Technical Analyst and Content Writer who has been working in the cryptocurrency industry since 2012. He also has a passion for trading.


