Ethereum price flashes bullish technical signal as ETH offers hope of recovery
- Ethereum price has continued to consolidate in a continuation pattern since early December.
- A technical indicator suggests that ETH could be ready for a bounce.
- Ethereum could surge 22% if the token slices above $4,099.

Ethereum price has been trending sideways in a consolidation pattern since December 3. ETH has formed a bullish signal, suggesting that the token could be ready to reverse the period of sluggish performance.
Ethereum price recovery could be challenging
Ethereum price has printed a symmetrical triangle pattern on the 4-hour chart amid an ongoing consolidation in the token. However, the Momentum Reversal Indicator (MRI) suggests that ETH is ready for a bounce toward the upside. The MRI flashed a bottom signal as the token approached the lower boundary of the prevailing chart pattern.
A potential recovery for Ethereum price could be tough, as many headwinds may emerge for the token. The first line of resistance is at the 100 four-hour Simple Moving Average (SMA) at $3,960, then at the 38.2% Fibonacci retracement level, coinciding with the 21 four-hour SMA at $3,988.
Additional resistances may appear at the 50 four-hour SMA at $4,020 before Ethereum price reaches the upper boundary of the governing technical pattern at $4,099. If ETH slices above the aforementioned hurdle, a 22% surge could be on the radar, a target given by the prevailing chart pattern.
However, Ethereum price could face a tough challenge at the 200 four-hour SMA at $4,112, coinciding with the resistance line given by the MRI. Additional headwinds will appear at the 50% retracement level at $4,138, then at the 61.8% Fibonacci retracement level at $4,288, then at the 78.6% Fibonacci retracement level at $4,502.
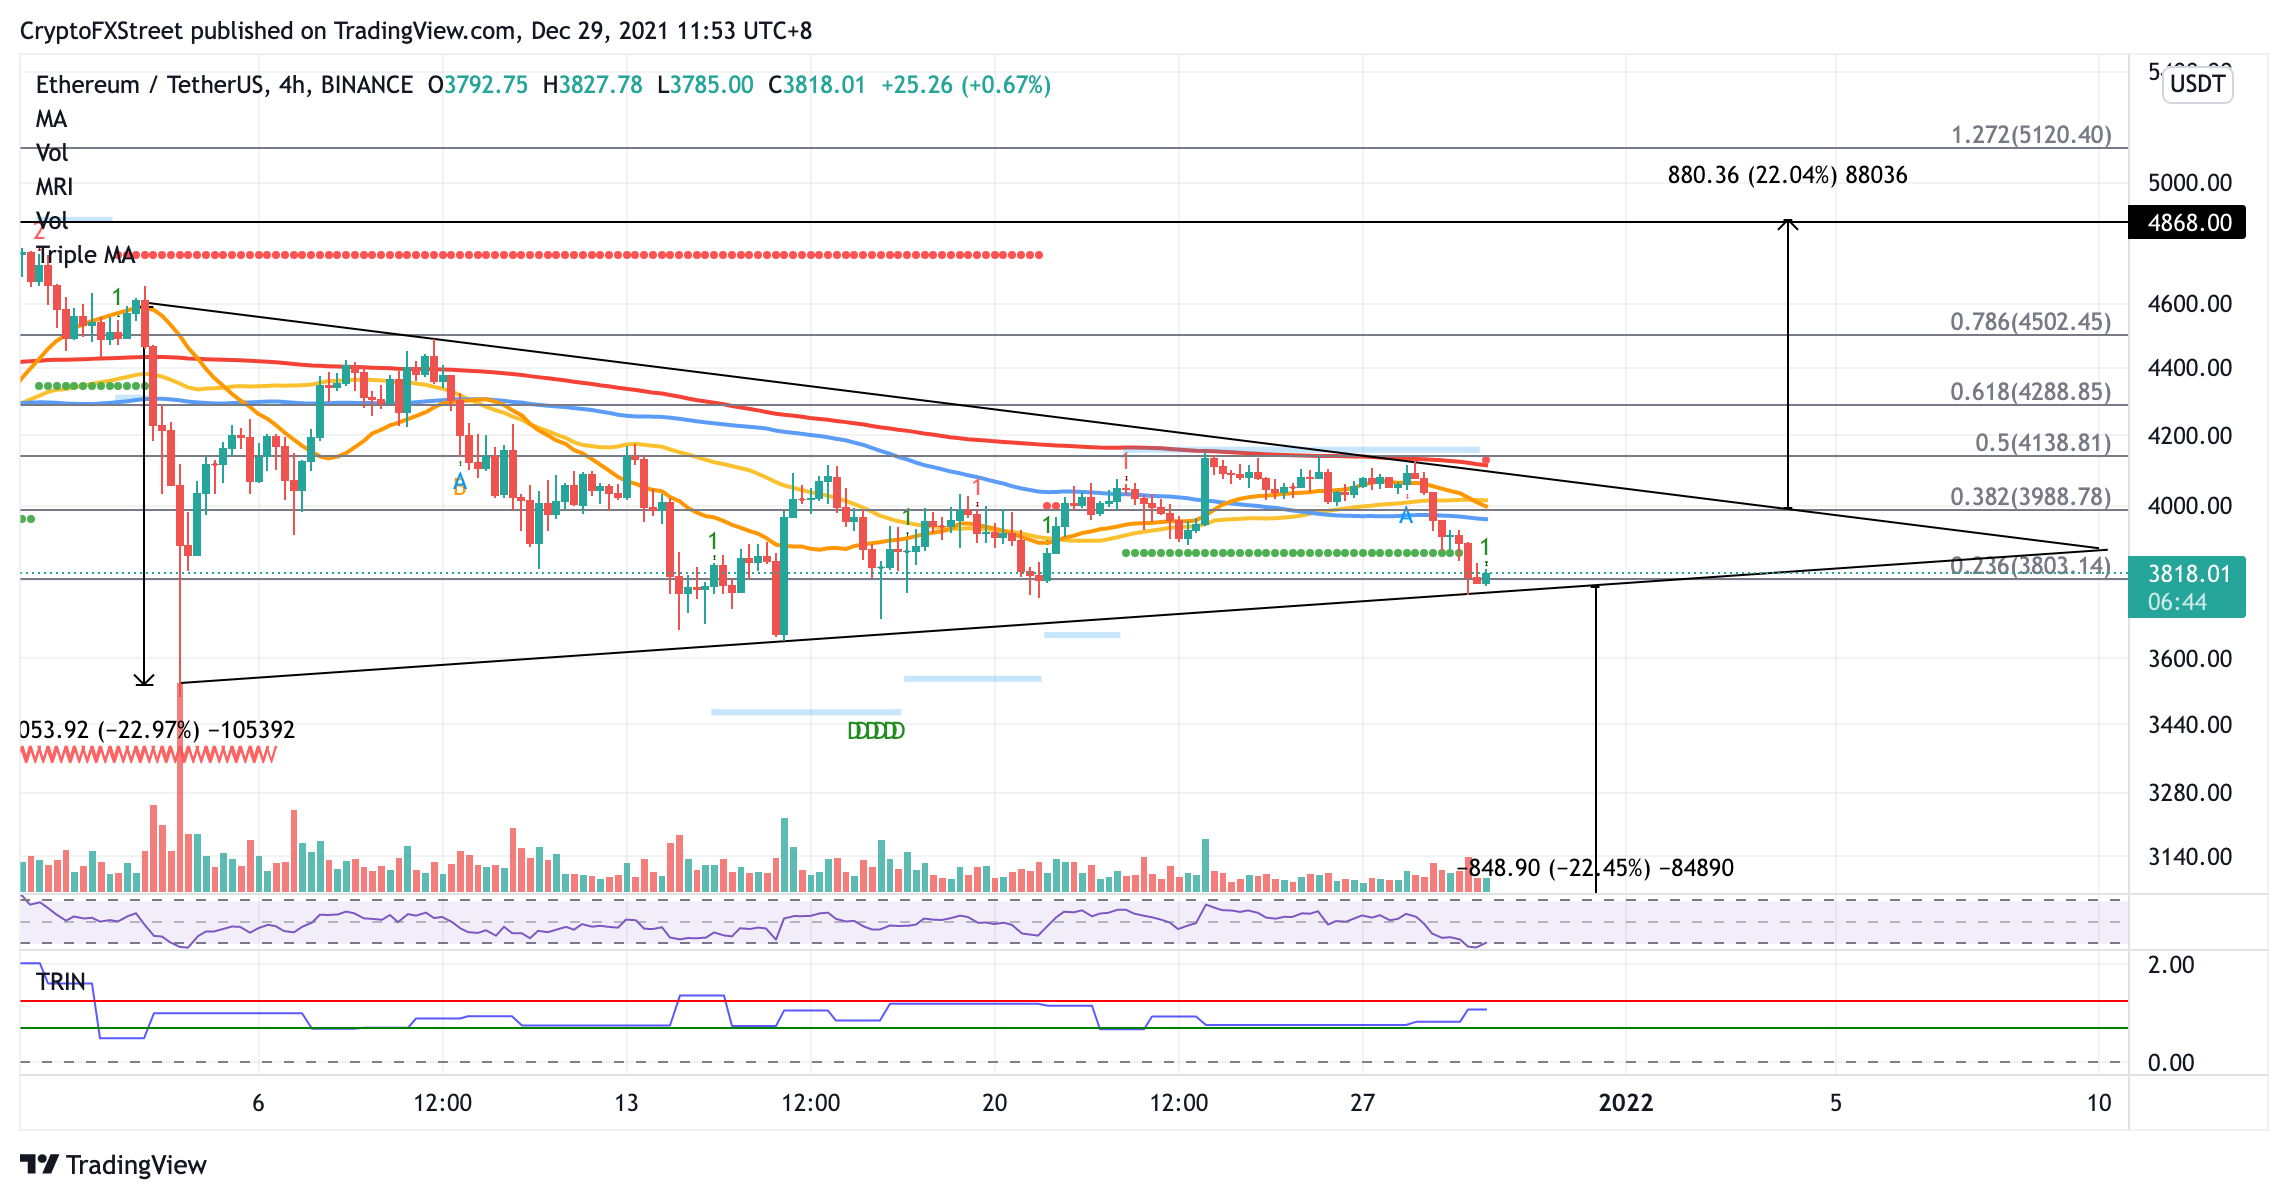
ETH/USDT 4-hour chart
If selling pressure increases, Ethereum price will discover meaningful support at the 23.6% Fibonacci retracement level at $3,803. Additional lines of defense will emerge at the December 16 low at $3,645, then at the December 4 low at $3,511.
Investors should note that if Ethereum slices below the lower boundary of the symmetrical triangle pattern at $3,768, ETH could be vulnerable to a 22% slide toward $2,934.
Author

Sarah Tran
Independent Analyst
Sarah has closely followed the growth of blockchain technology and its adoption since 2016.


