Ethereum price breaks through $3K, but analysts warn that a retest is needed

ETH price finally pushed through the $3,000 barrier and while further upside is warranted, analysts believe that retest of lower levels will happen first.
The cryptocurrency market continues to forge ahead on March 23 despite facing headwinds on multiple fronts. At the moment, global conflict, rising inflation and widespread economic uncertainty are taking a toll on financial markets and helping to highlight the need for a diversified investmen portfolio.
Altcoins have managed to gain some ground in recent days, led by Ethereum, the top smart contract platform, which managed to climb back to the major support and resistance zone at $3,000 where bulls are now battling for control.
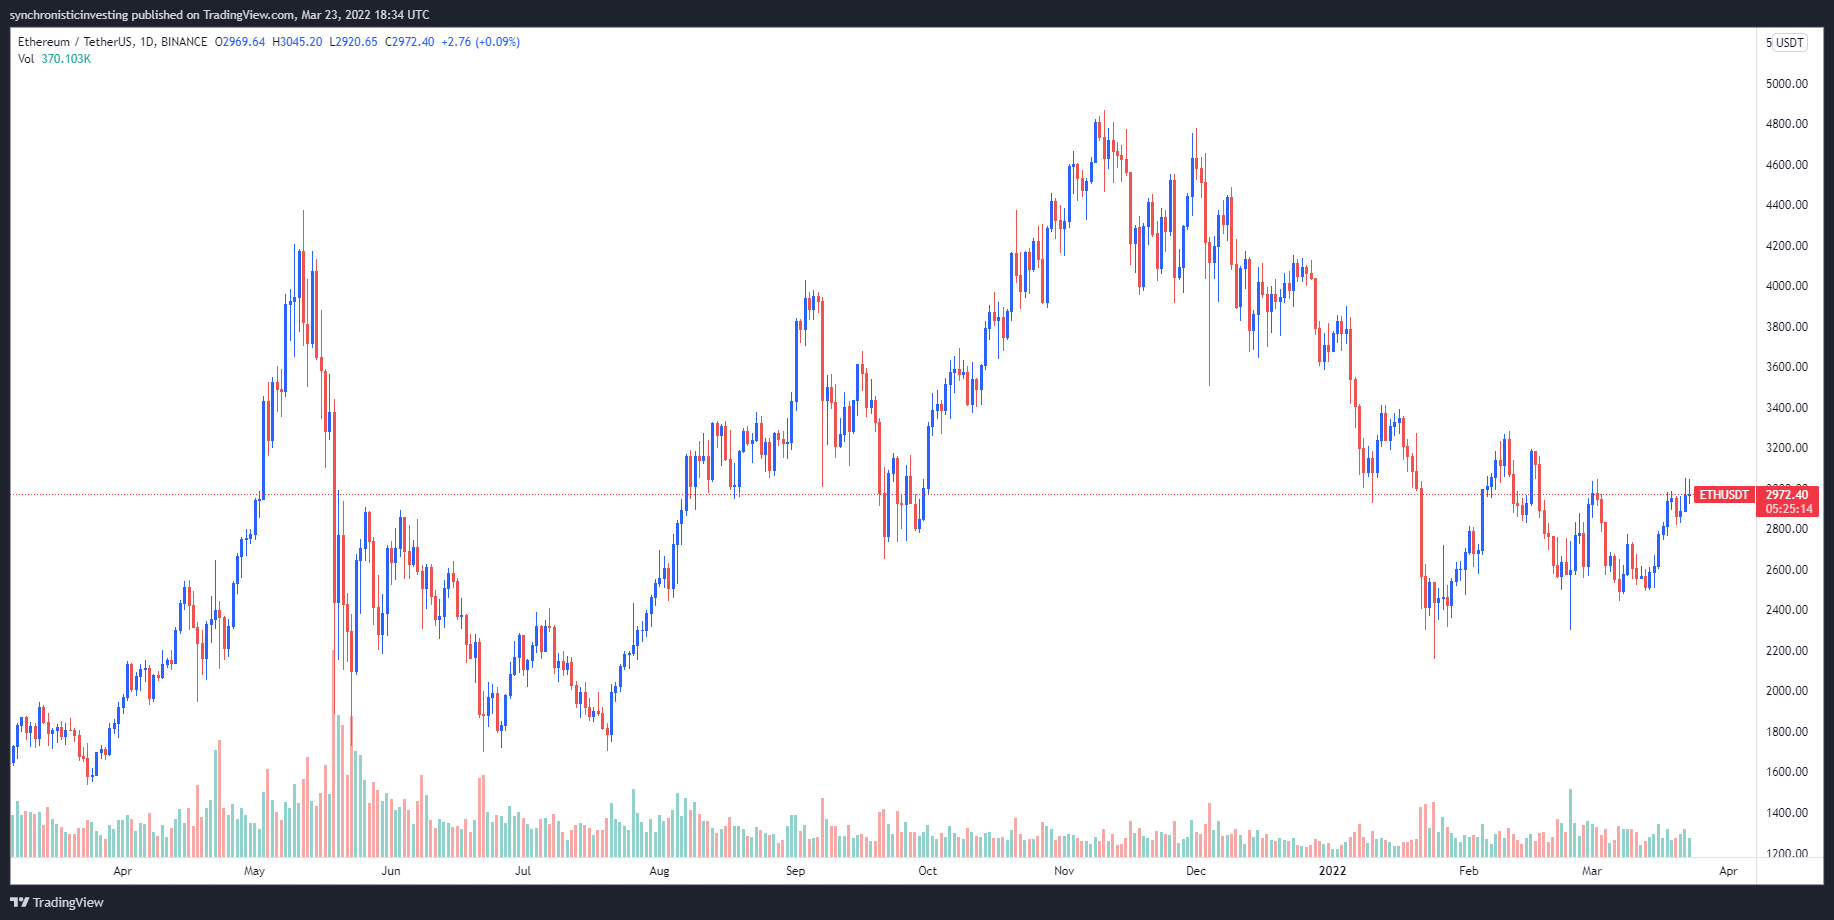
ETH/USDT 1-day chart. Source: TradingView
Here’s a look at what several analysts in the market are saying about the path forward for Ether and whether or not further upside is expected in the short-term.
Upcoming test of $3,125
A general overview of the recent price action was provided by crypto analyst Michaël van de Poppe, who posted the following chart showing “Ethereum moving upward after holding crucial level.”
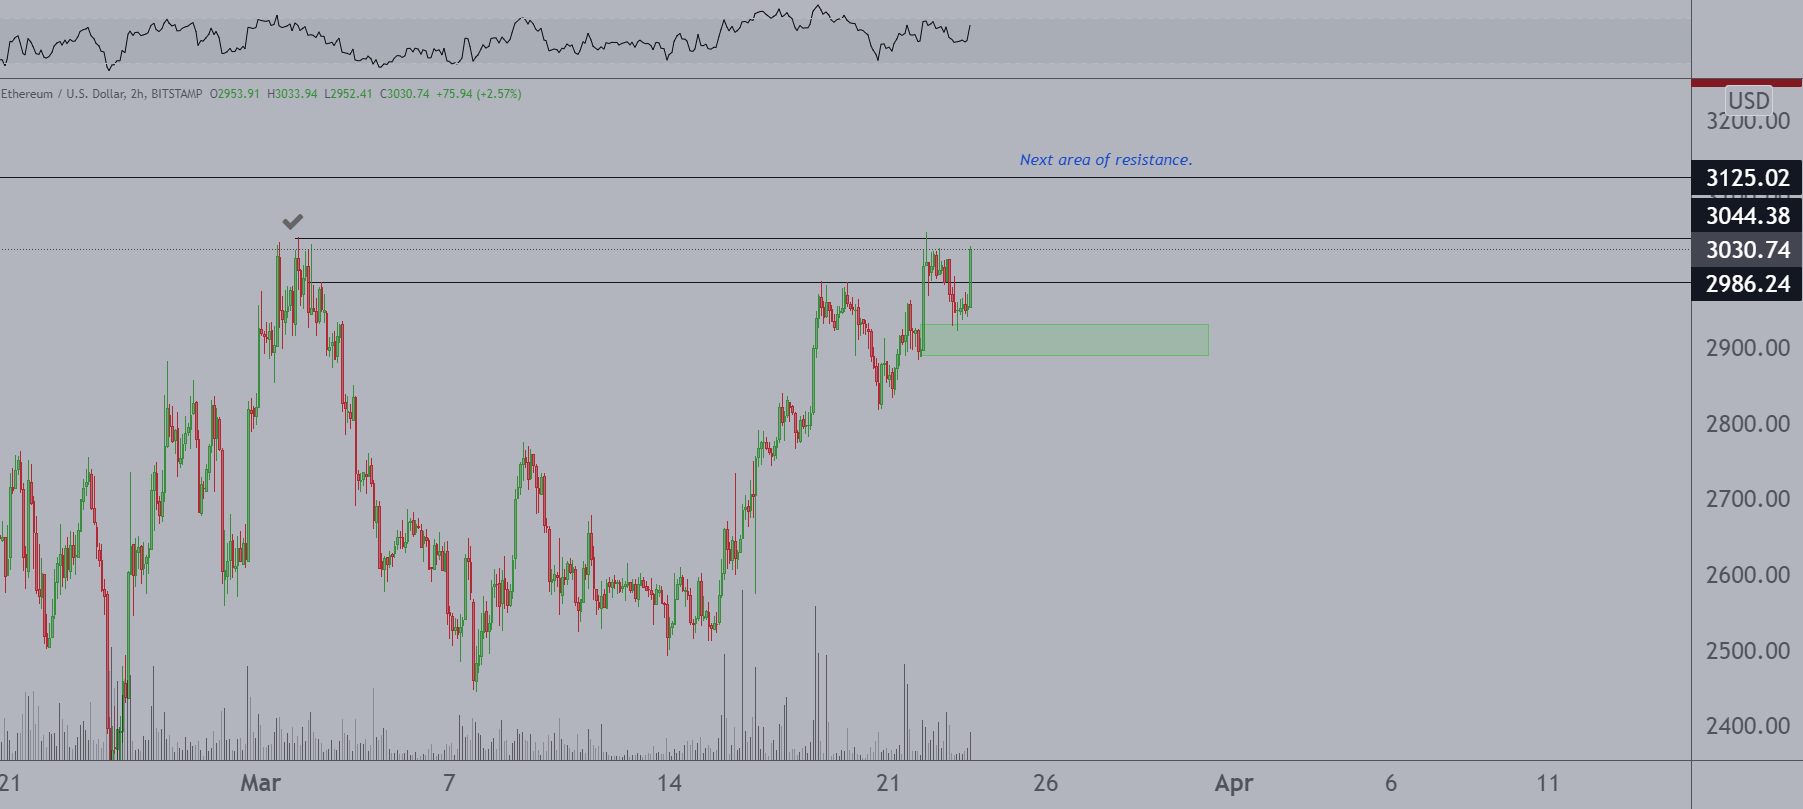
ETH/USD 2-hour chart. Source: Twitter
van de Poppe said,
Seems to me that we're going to test $3,125 next.
But not all traders were so quick to look for a higher price target, including pseudonymous Twitter user ‘Chartpunk’, who posted the following chart highlighting the ten-day uptrend for Ethereum and warned against jumping into an overheated market.
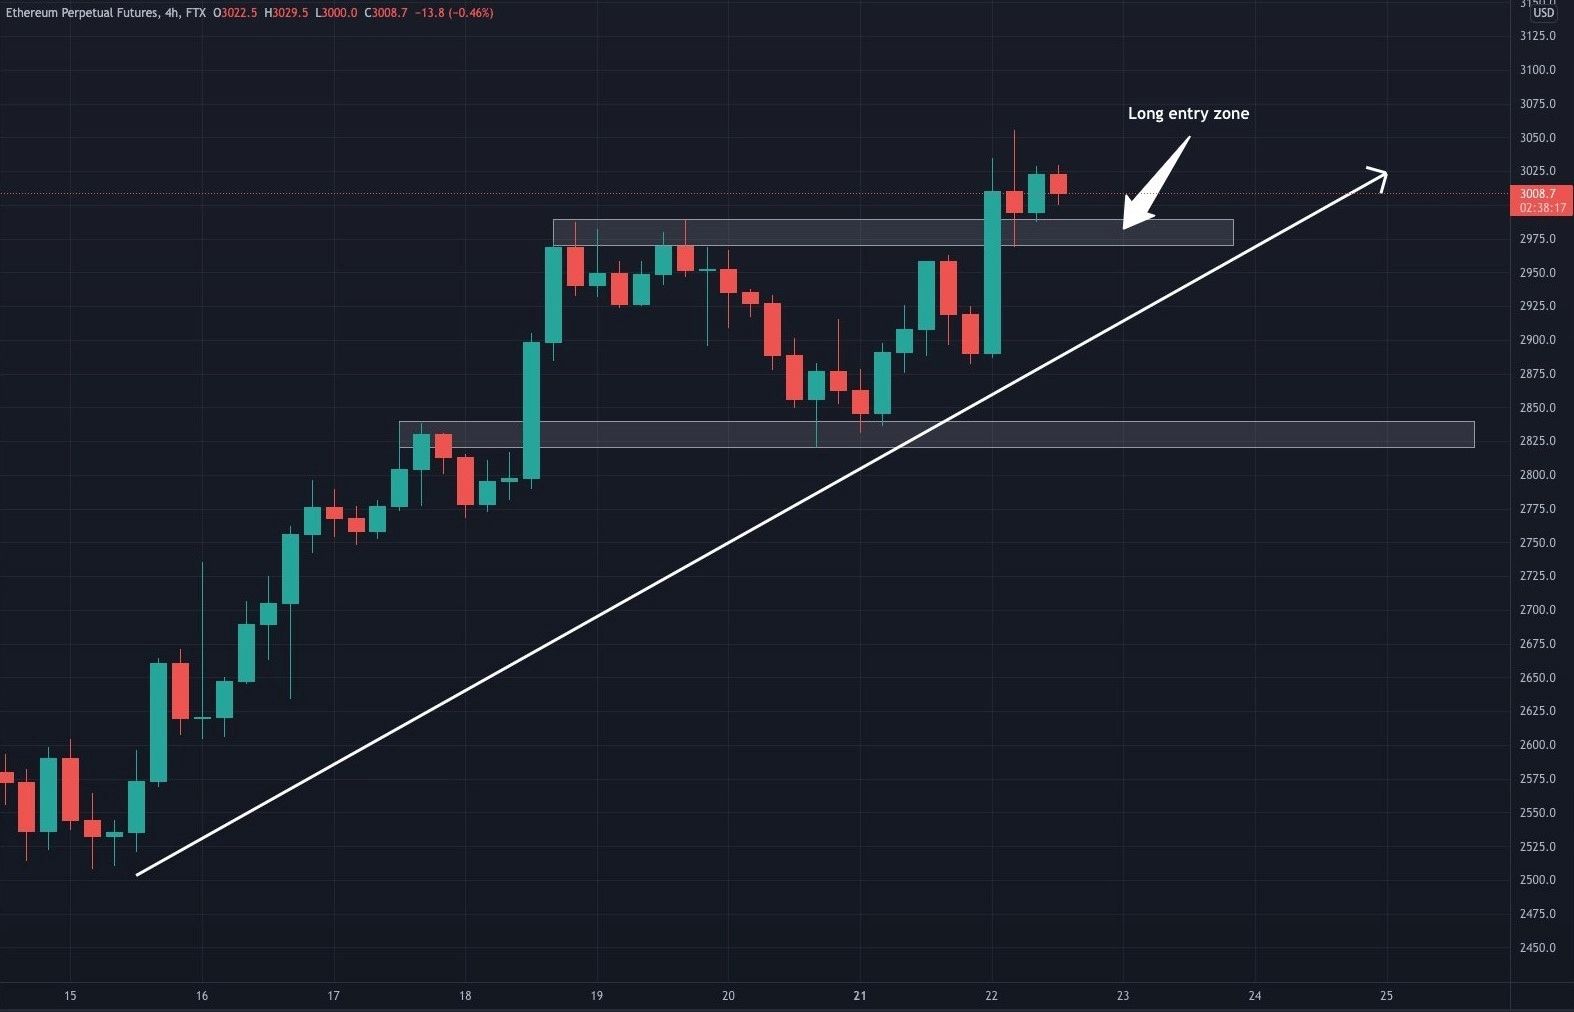
ETH/USD 4-hour chart. Source: Twitter
Chartpunk said,
Do not FOMO into the market. Should you want to join the trend, look for the retest of the entry zone on this chart.
Based on the area highlighted in the chart, Charpunk is looking for re-entry around $2,975.
Sentiment is neutral until $3,287
A more measured approach to the current price action was offered by crypto trader and pseudonymous Twitter user ‘Mad Max Crypto’, who posted the following chart indicating a “Neutral bias till it flips the $3,287 mark.”
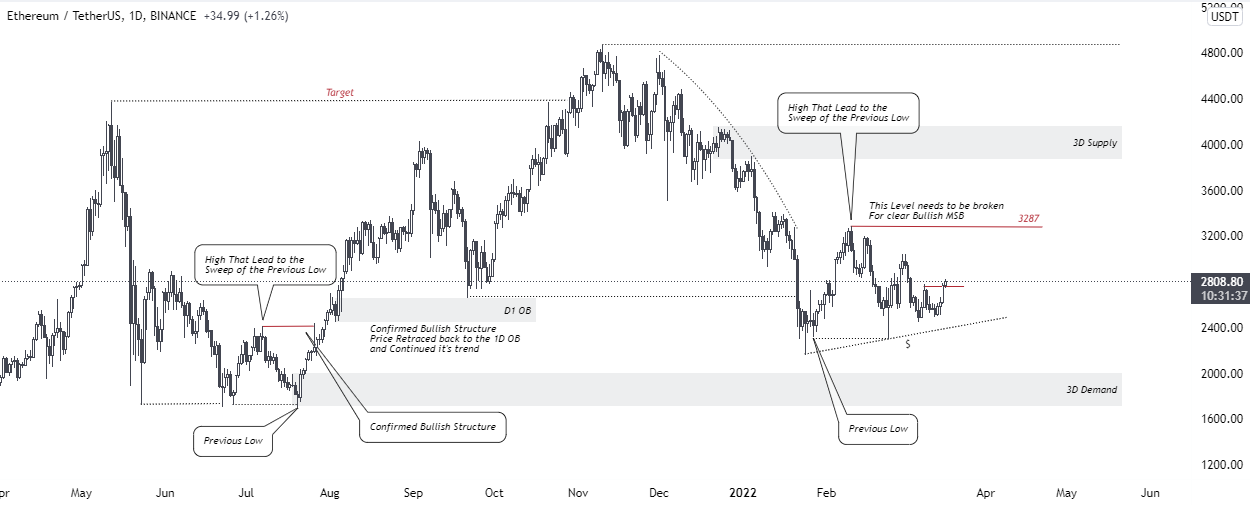
ETH/USDT 1-day chart. Source: Twitter
This outlook was largely echoed by cryptocurrency advisor and pseudonymous Twitter user ‘Altcoin Sherpa’, who posted the following chart highlighting the series of higher lows and higher highs made by Ether.
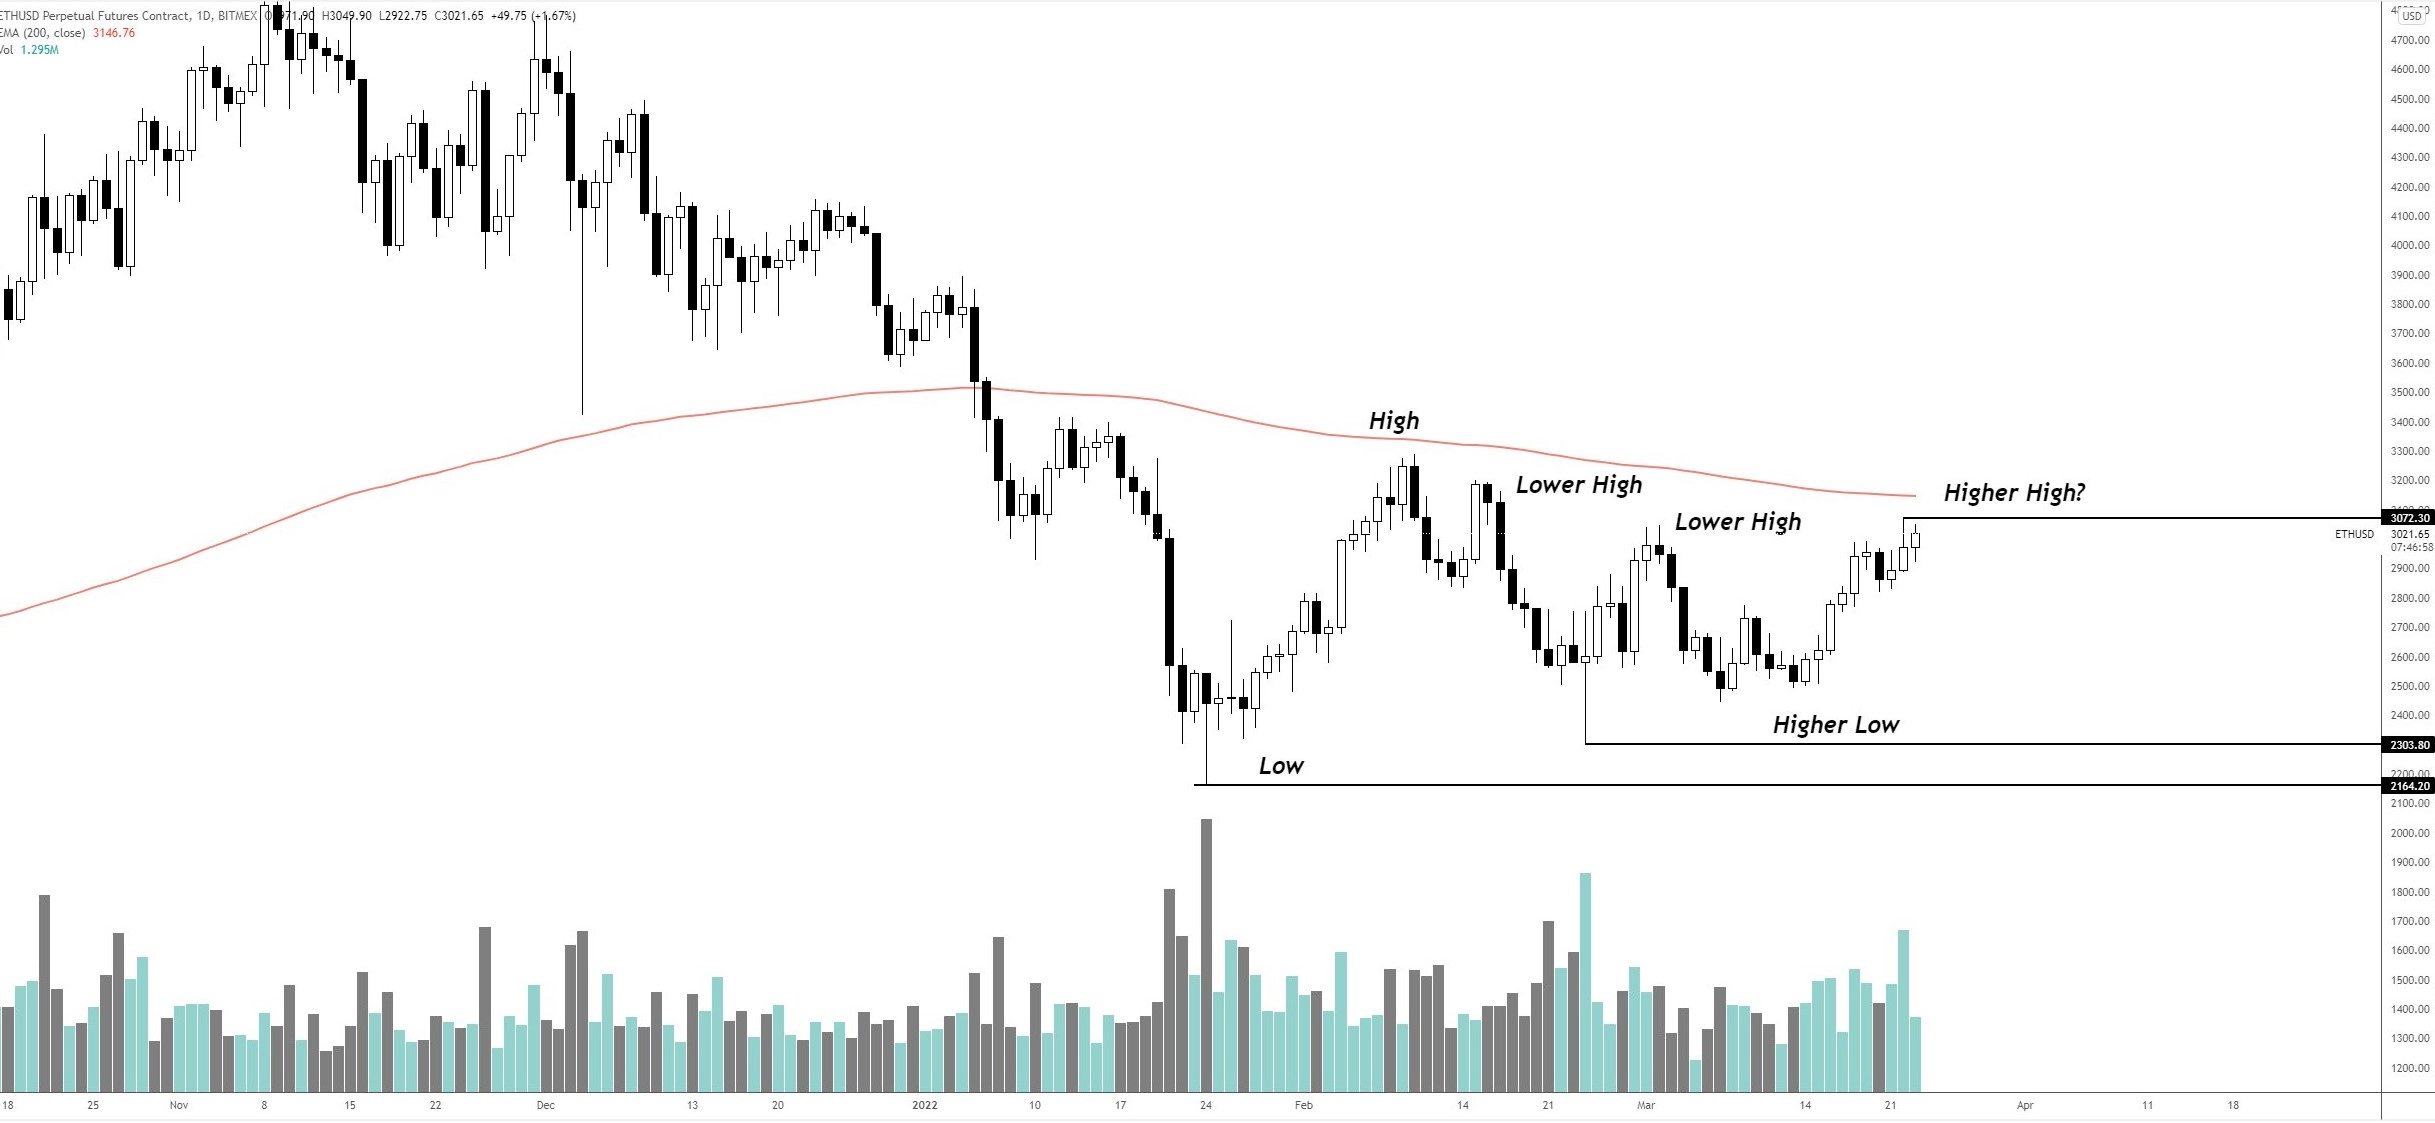
Altcoin Sherpa said,
I think that you can make an argument for breaking market structure to the upside on lower time frame charts but I'm personally waiting for the higher levels. Regardless, ETH2.0 fundamentals are going to be strong coming soon.
A possible pullback to $2,600
A final bit of analysis on the lower price levels to keep an eye on was touched on by crypto trader and pseudonymous Twitter user ‘Follis’, who posted the following chart suggesting the possibility of a pullback to $2,600.
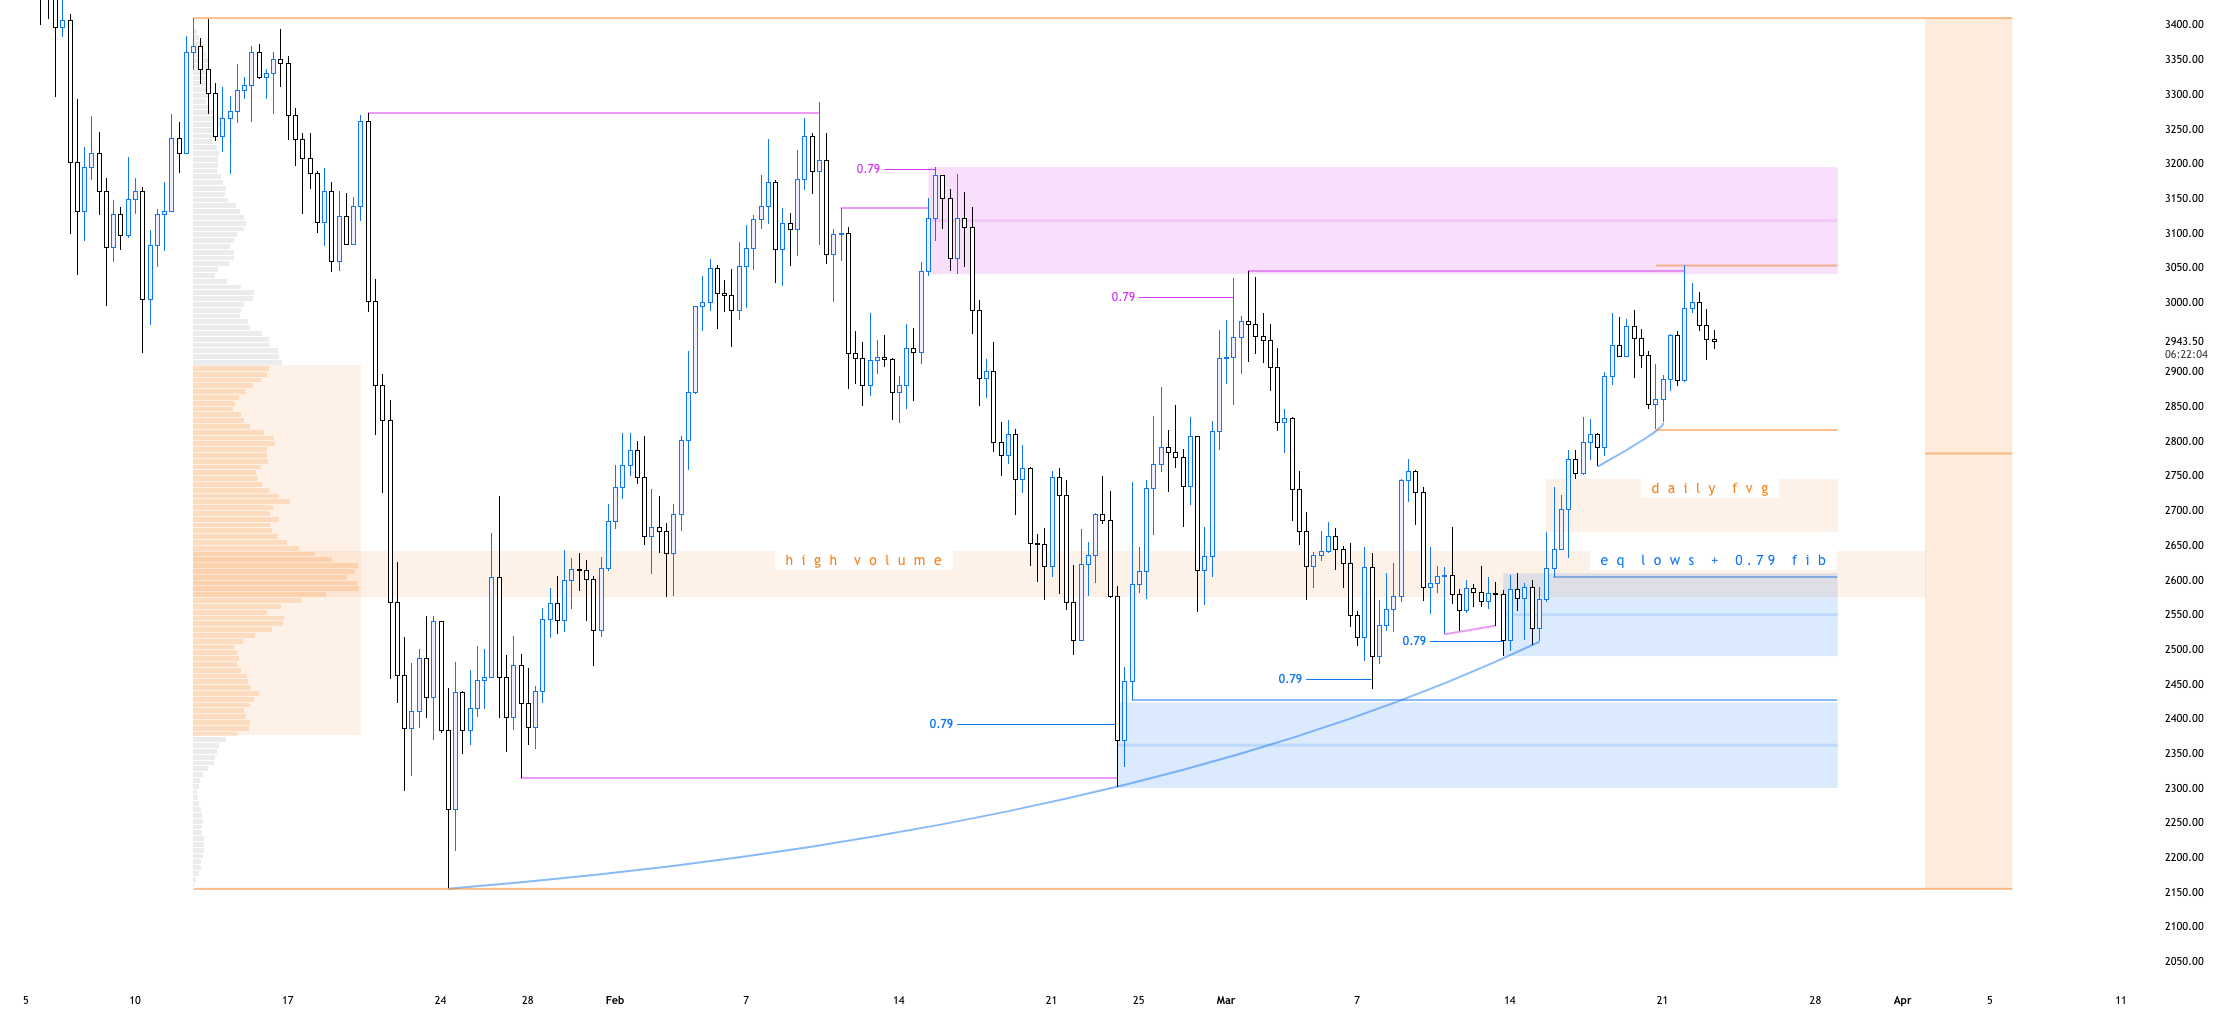
Follis said,
Strong reaction from that sweep into supply, but most hourly time frames are bullish, and I expect more upside as long as we don't close below $2,800. $2,600 area is interesting if we get a pullback, the 0.79 fib has worked well within this macro range.
The overall cryptocurrency market cap now stands at $1.919 trillion and Bitcoin’s dominance rate is 41.7%.
Author

Cointelegraph Team
Cointelegraph
We are privileged enough to work with the best and brightest in Bitcoin.




