Ethereum Price Analysis: ETH/USD moves away from $100.00, heads to $120.00
- ETH/USD gets a chance to retest resistance of $120.00.
- Psychological $100.00 will serve as a backstop for sellers.

Ethereum (ETH) stopped within a whisker of critical $100.00 and managed to recover to $117.00 by press time. The second-largest cryptocurrency has gained about 5% both on a day-to-day basis and since the beginning of the day as the market is back on recovery track after another painful sell-off on Monday.
ETH/USD: Technical picture
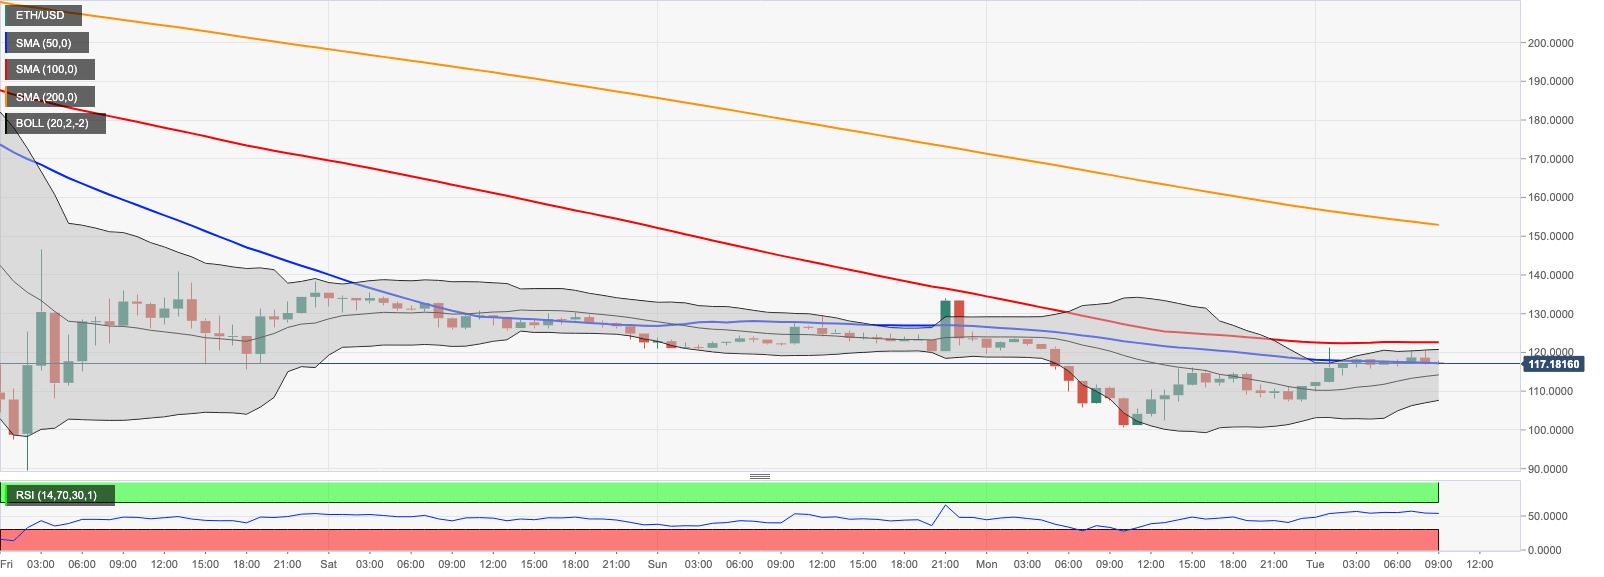
ETH/USD found a bottom on approach to psychological $100.00. However, the recovery momentum is losing traction on approach t $120.00. This barrier is reinforced by the middle line of 4-hour Bollinger Band and the upper line of 1-hour Bollinger Band. Once this resistance is out of the way, the recovery may gain traction with the next focus on $122.50 (SMA100 1-hour), An ultimate short-term barrier awaits ETH bulls at $130.00. A sustainable move higher will mitigate the initial bearish pressure and allow for an extended recovery.
On the downside, the initial support is created by $110.00. If it is broken, the sell-off may be extended towards $107.50 (the lower line of 1-hour Bollinger Band) and to Monday's low of $100.77. This area is likely to slow down the sell-off and serve as a backstop for the time being. However, another massive shock on the global markets will push ETH below psychological $100.00 towards the March 13 low of $89.64. Below is the abyss.
Meanwhile, the number of ETH addresses in the money increased from zero to 3%, according to Intotheblock data. A big cluster of addresses has the break-even point on the approach to $100.00, which means this area has a strong potential as support.
ETH/USD 1-hour chart
Author

Tanya Abrosimova
Independent Analyst



