Ethereum price analysis: ETH/USD breaks back above long-running trend line, weekly close above will be key
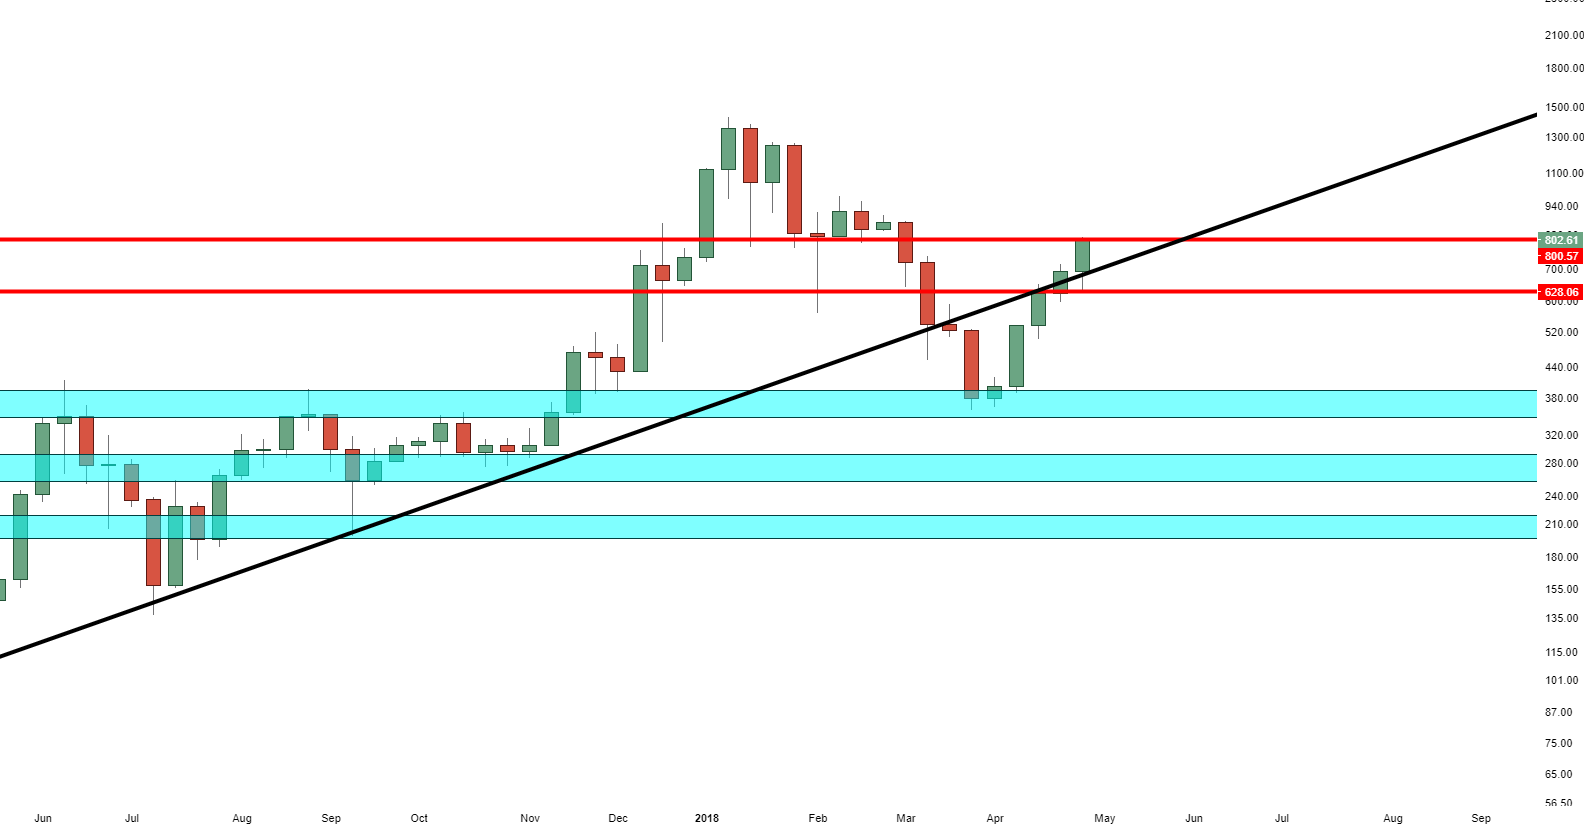
- Ethereum has broken the ascending trend line running from May 2017 on the daily time frame, a weekly close above would be key for further upside.
- ETH/USD has closed in the green consecutively for the past going on 5 weeks now, gaining over 115%.

The Ethereum price is seen up 1.5% on Friday, having managed to produce a robust performance for the second part of the week. A jump in the price coming after a bullish pennant pattern was broken to the upside, seeing ETH/USD further on its way north.
ETH/USD has had an incredible past few weeks, consistent weekly gains have been observed for the past five consecutive weeks. As seen across most of the major altcoins, it appears to be that the longer-term trend is finally changing, after the heavy bearish moves seen from the start of the year. Ethereum has gained over 115% within the mentioned period.
Technically, ETH/USD looks subject to some greater buying pressure, given the price moving back above the trend line running from May 2017. A daily close was seen above the trend line on Thursday’s session, the weekly however will be key. Despite all of the recent bullish action this past five weeks, the MACD indicator is still signalling a bear market, but, the signal line is edging back closer to moving below the MACD.
ETH/USD daily chart
Author

Ken Chigbo
Independent Analyst
Ken has over 8 years exposure to the financial markets. He started his career as an analyst, covering a variety of asset classes; forex, fixed income, commodities and equities.


