Ethereum price aims to flush out doubters before the ultimate breakout to $2,000
- Ethereum price has briefly overtaken $1,200 again and it’s outperforming Bitcoin.
- The number of negative social media posts about ETH continue to increase.

Ethereum bulls bought the dip on January 11, pushing the digital asset from a low of $915 towards $1,256. The smart-contracts giant has been outperforming Bitcoin in the past 24 hours despite the negativity seen on social media.
Ethereum price outperforms Bitcoin and targets $2,000
There is a symmetrical triangle formed on the 12-hour chart of the ETH/BTC, which is close to bursting. Additionally, this could also be considered a bull flag with its pole formed from January 2 to January 4.
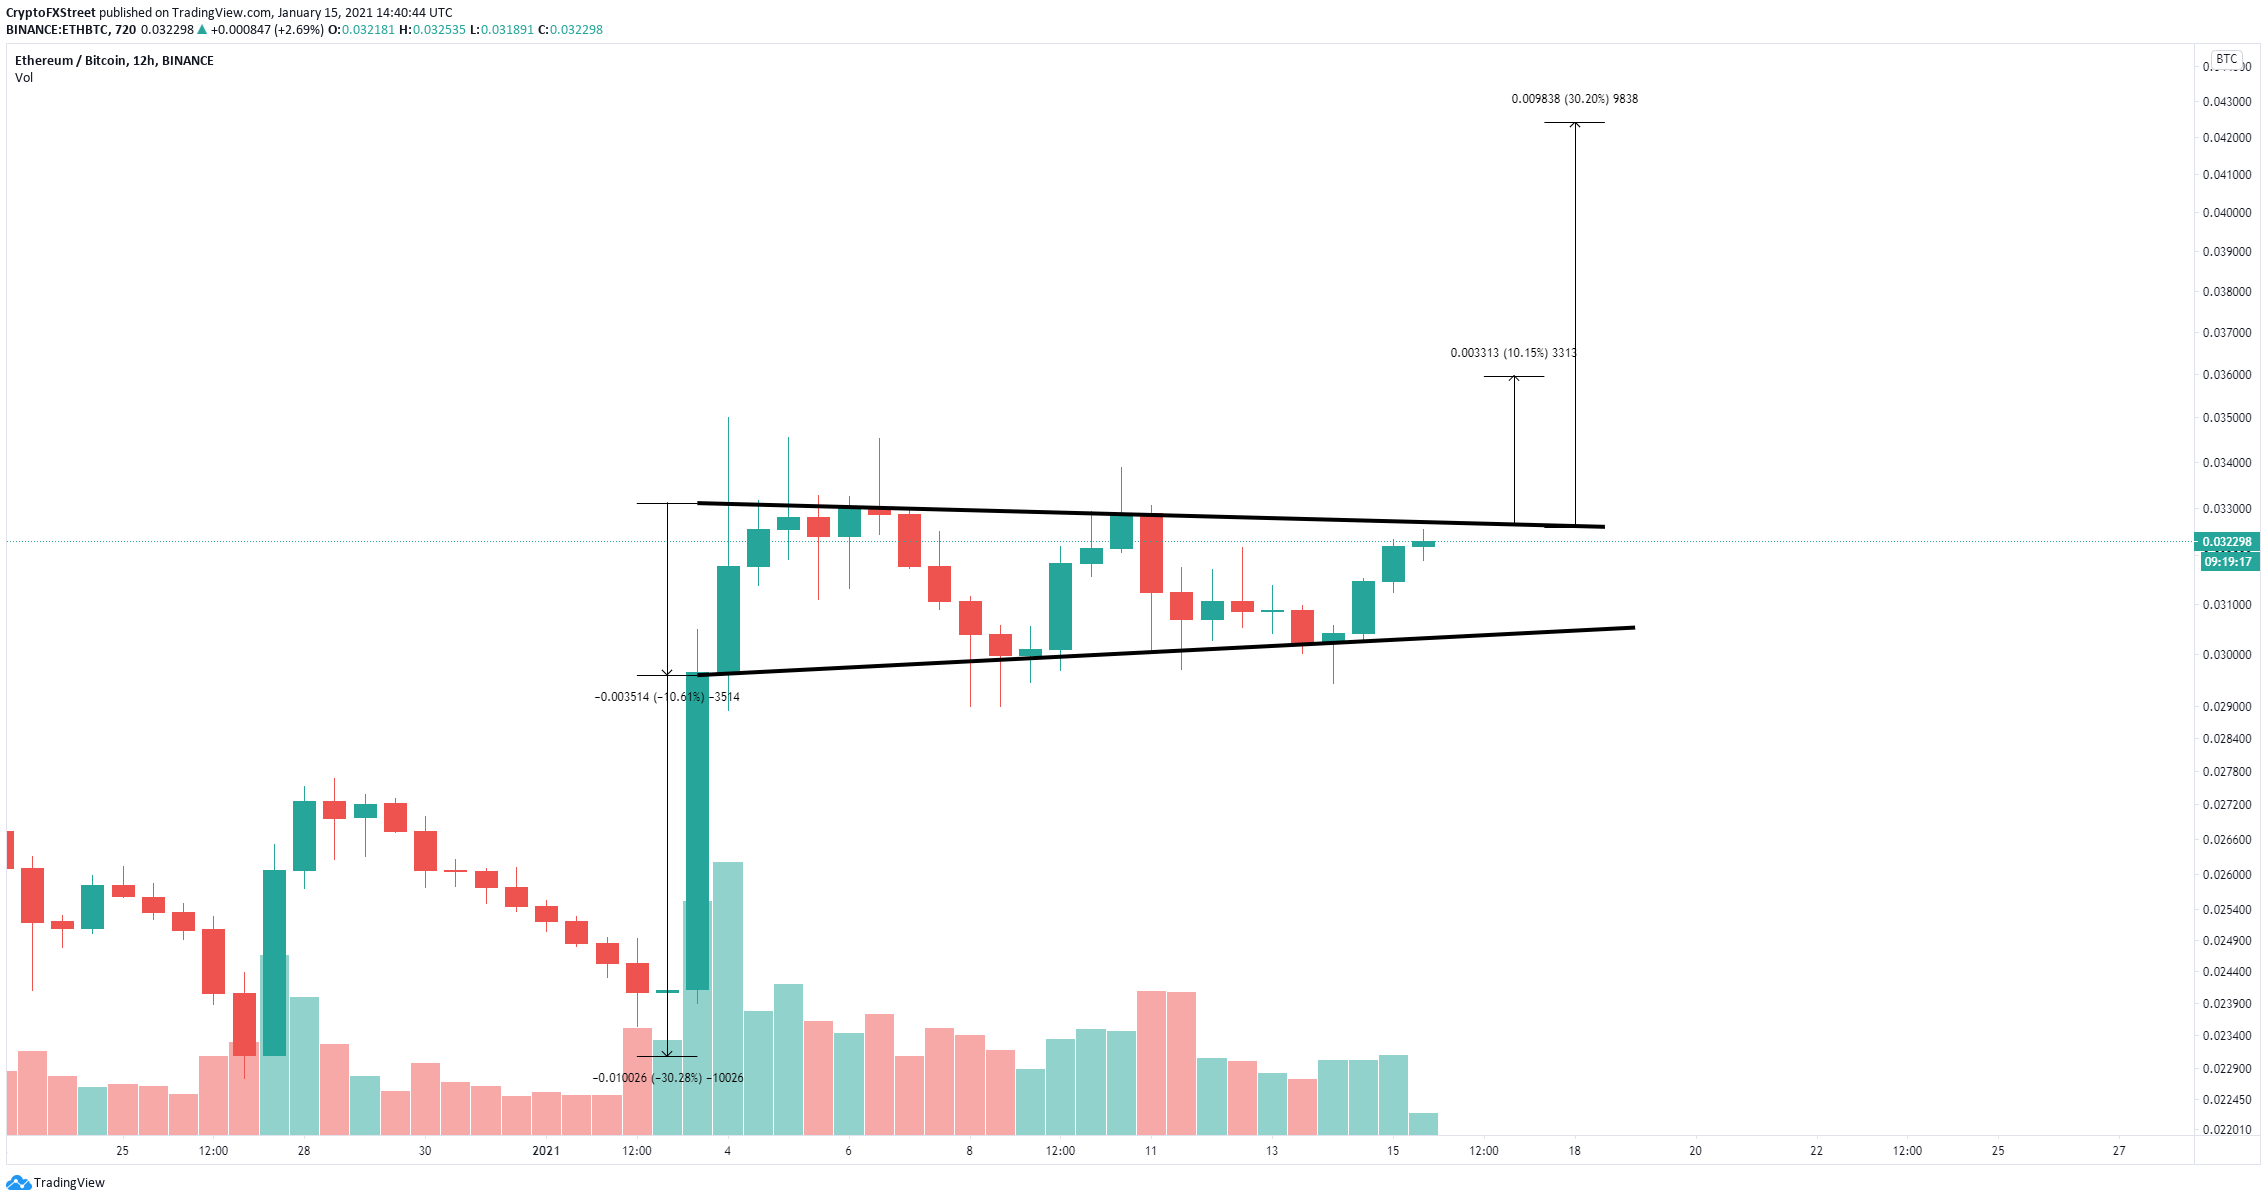
ETH/BTC 12-hour chart
A breakout above the upper trendline of the symmetrical triangle can push Ethereum to 0.0359 BTC and as high as 0.042 BTC if the bull flag is confirmed. So far, ETH price has outperformed Bitcoin in the past 48 hours, which indicates a breakout has better odds of happening.
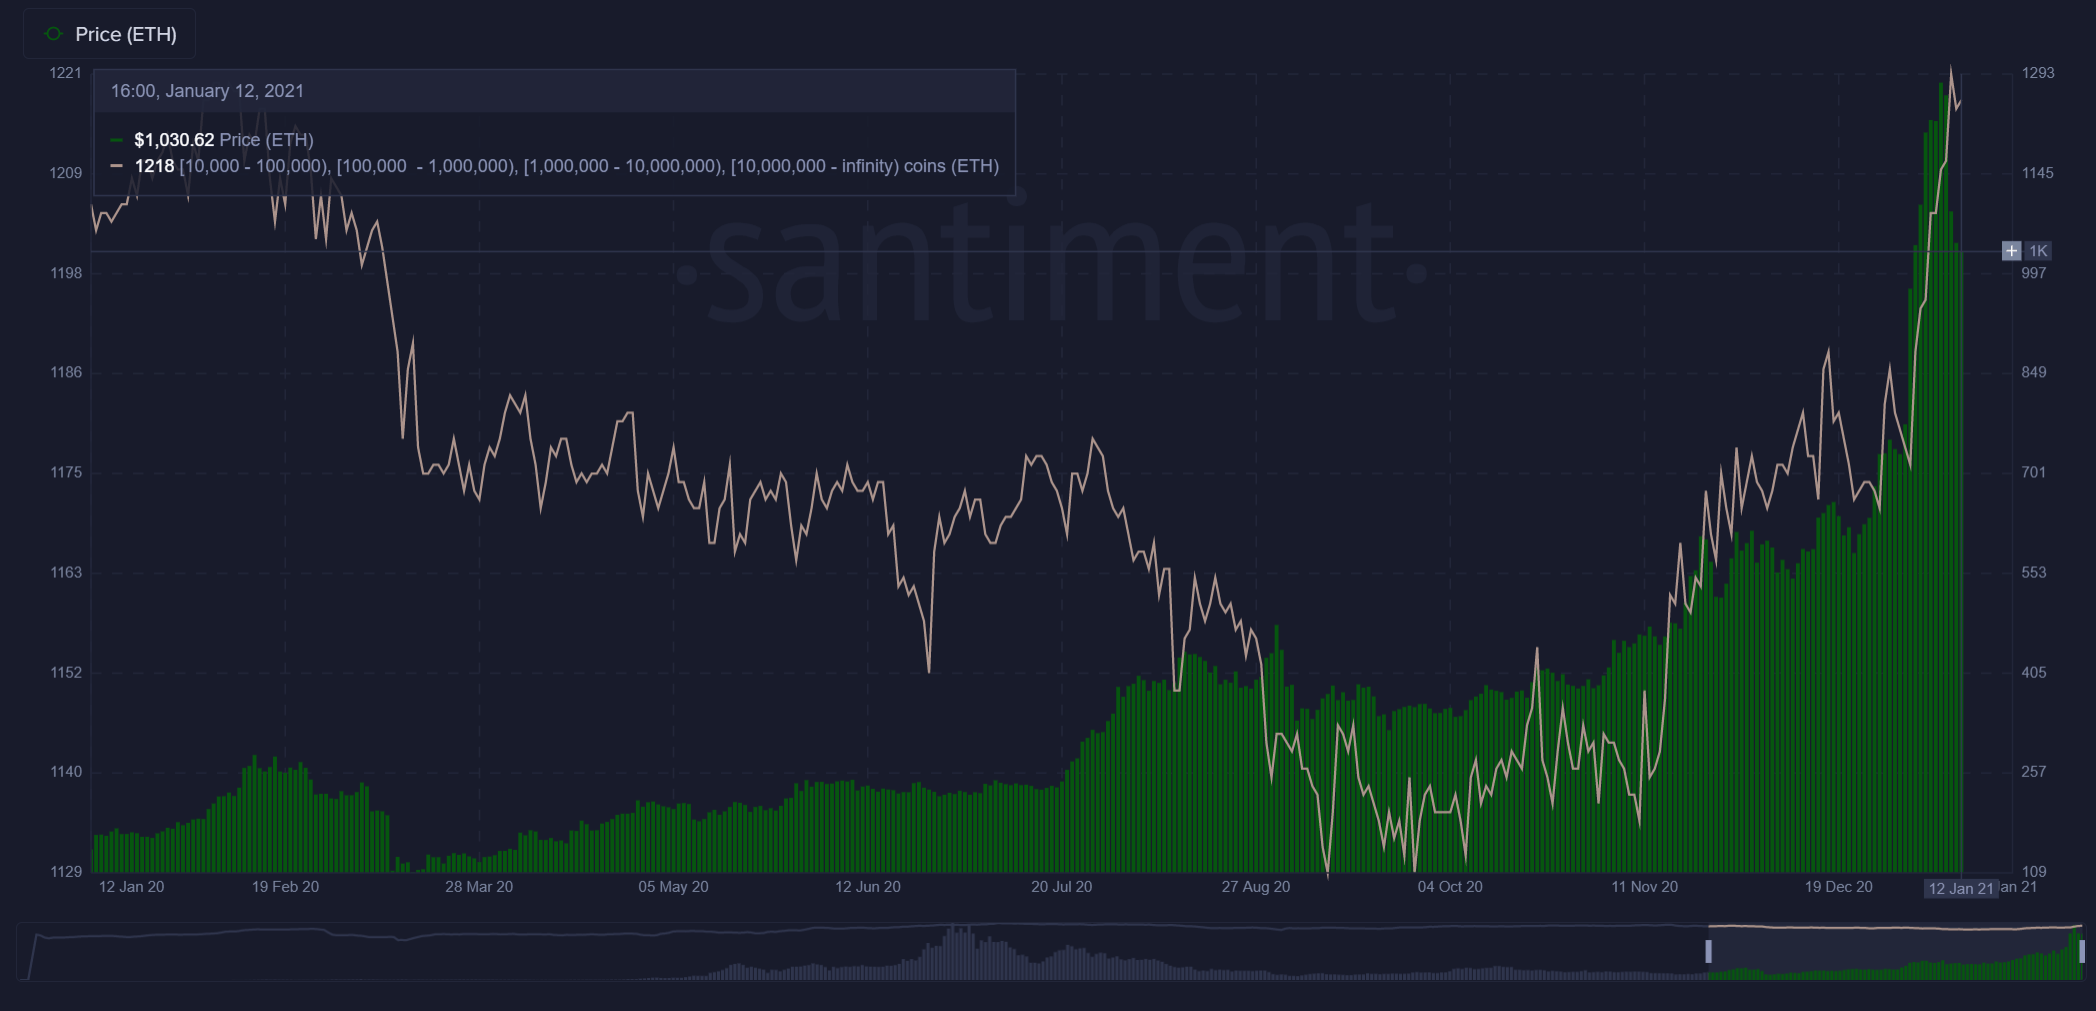
ETH Holders Distribution chart
Additionally, the number of whales entering the Ethereum network has increased tremendously since October 2020, especially in the past month, which indicates that large holders expect Ethereum price to rise even higher as they are buying at the top.
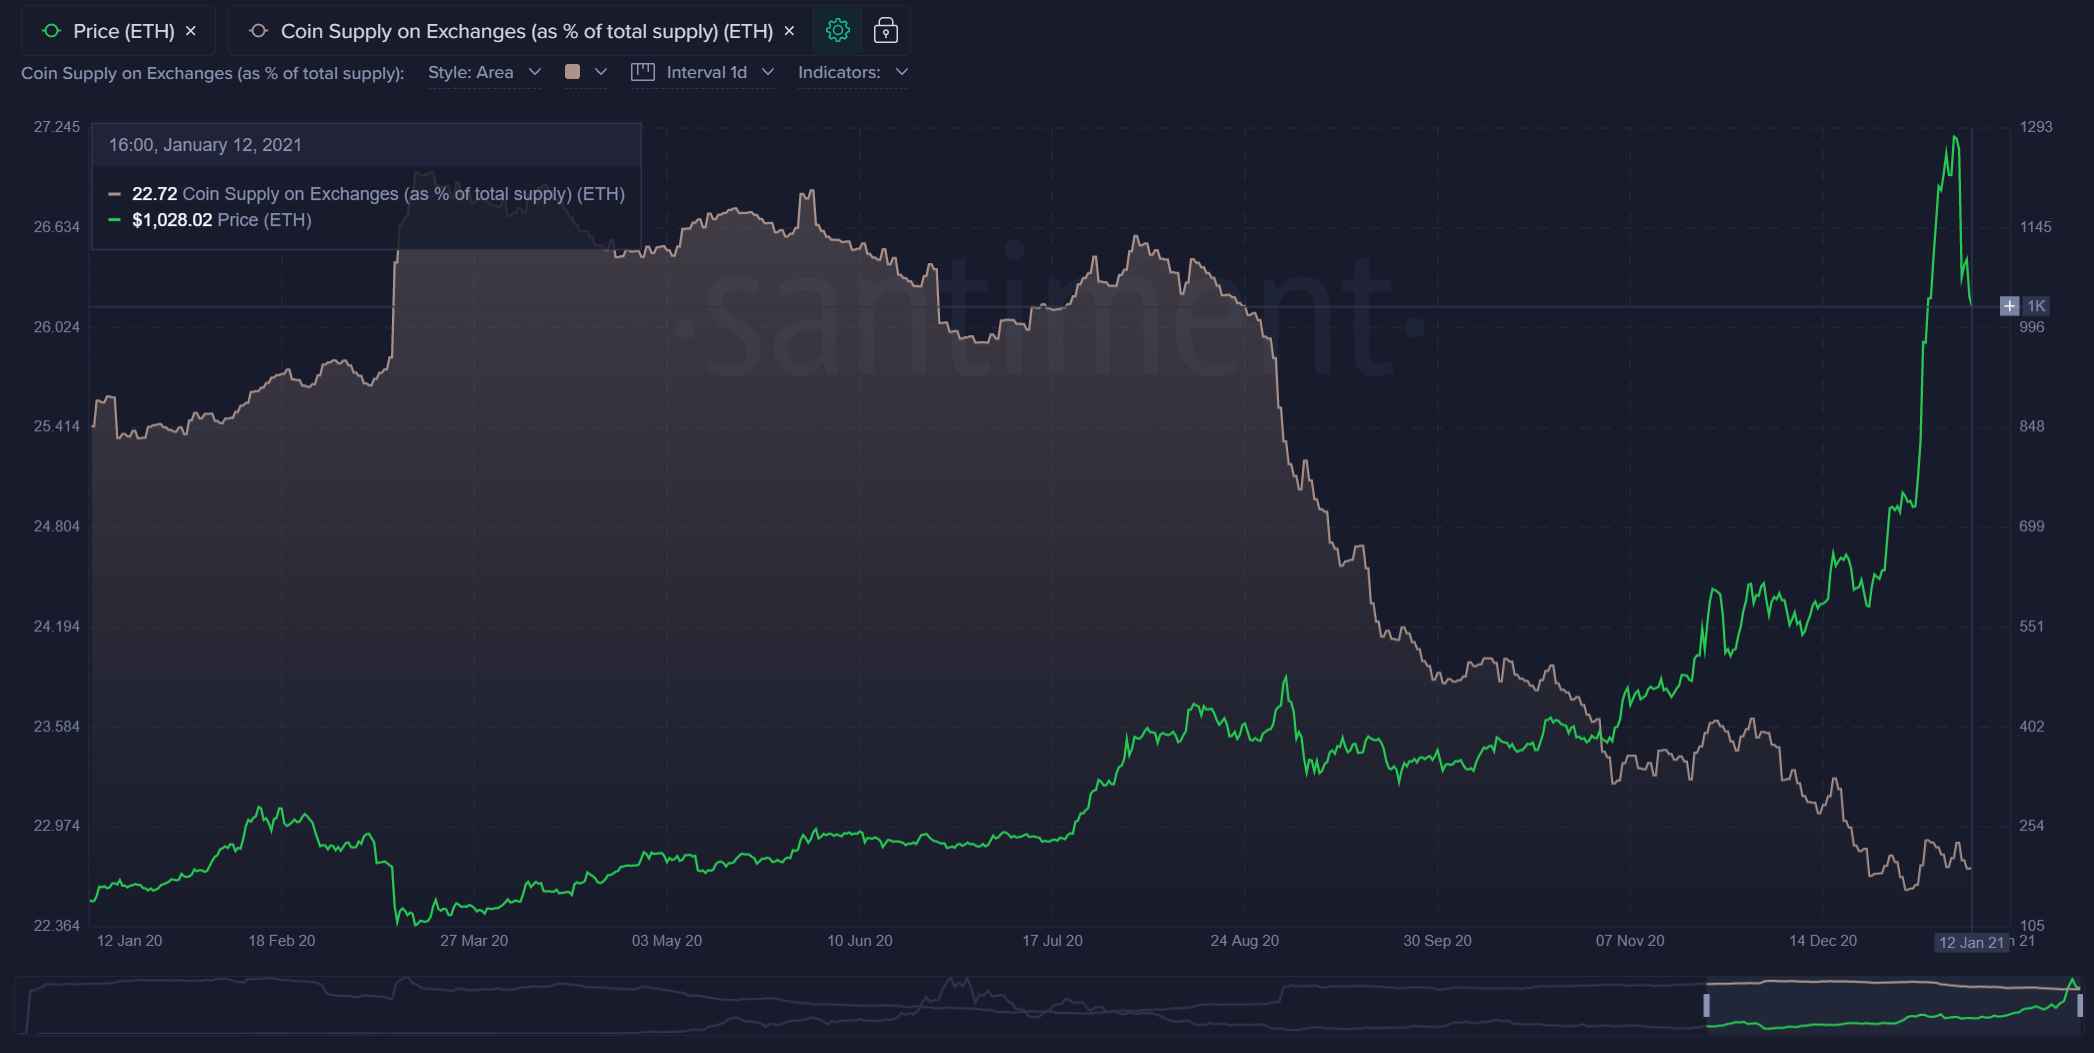
Ethereum supply on exchanges
Furthermore, the number of Ethereum coins inside exchanges continues to drop, again, despite Ethereum price rising, which indicates that investors are not taking profit just yet. At the same time, more ETH is locked inside the Eth2 deposit contract, which now holds over 2.51 million coins.
$20k
— Raoul Pal (@RaoulGMI) January 15, 2021
Raoul Pal, the Co-Founder and CEO of Real Vision Group believes Ethereum can reach $20,000 but didn’t specify over what time frame. However, the cryptocurrency market is volatile and anything can happen.
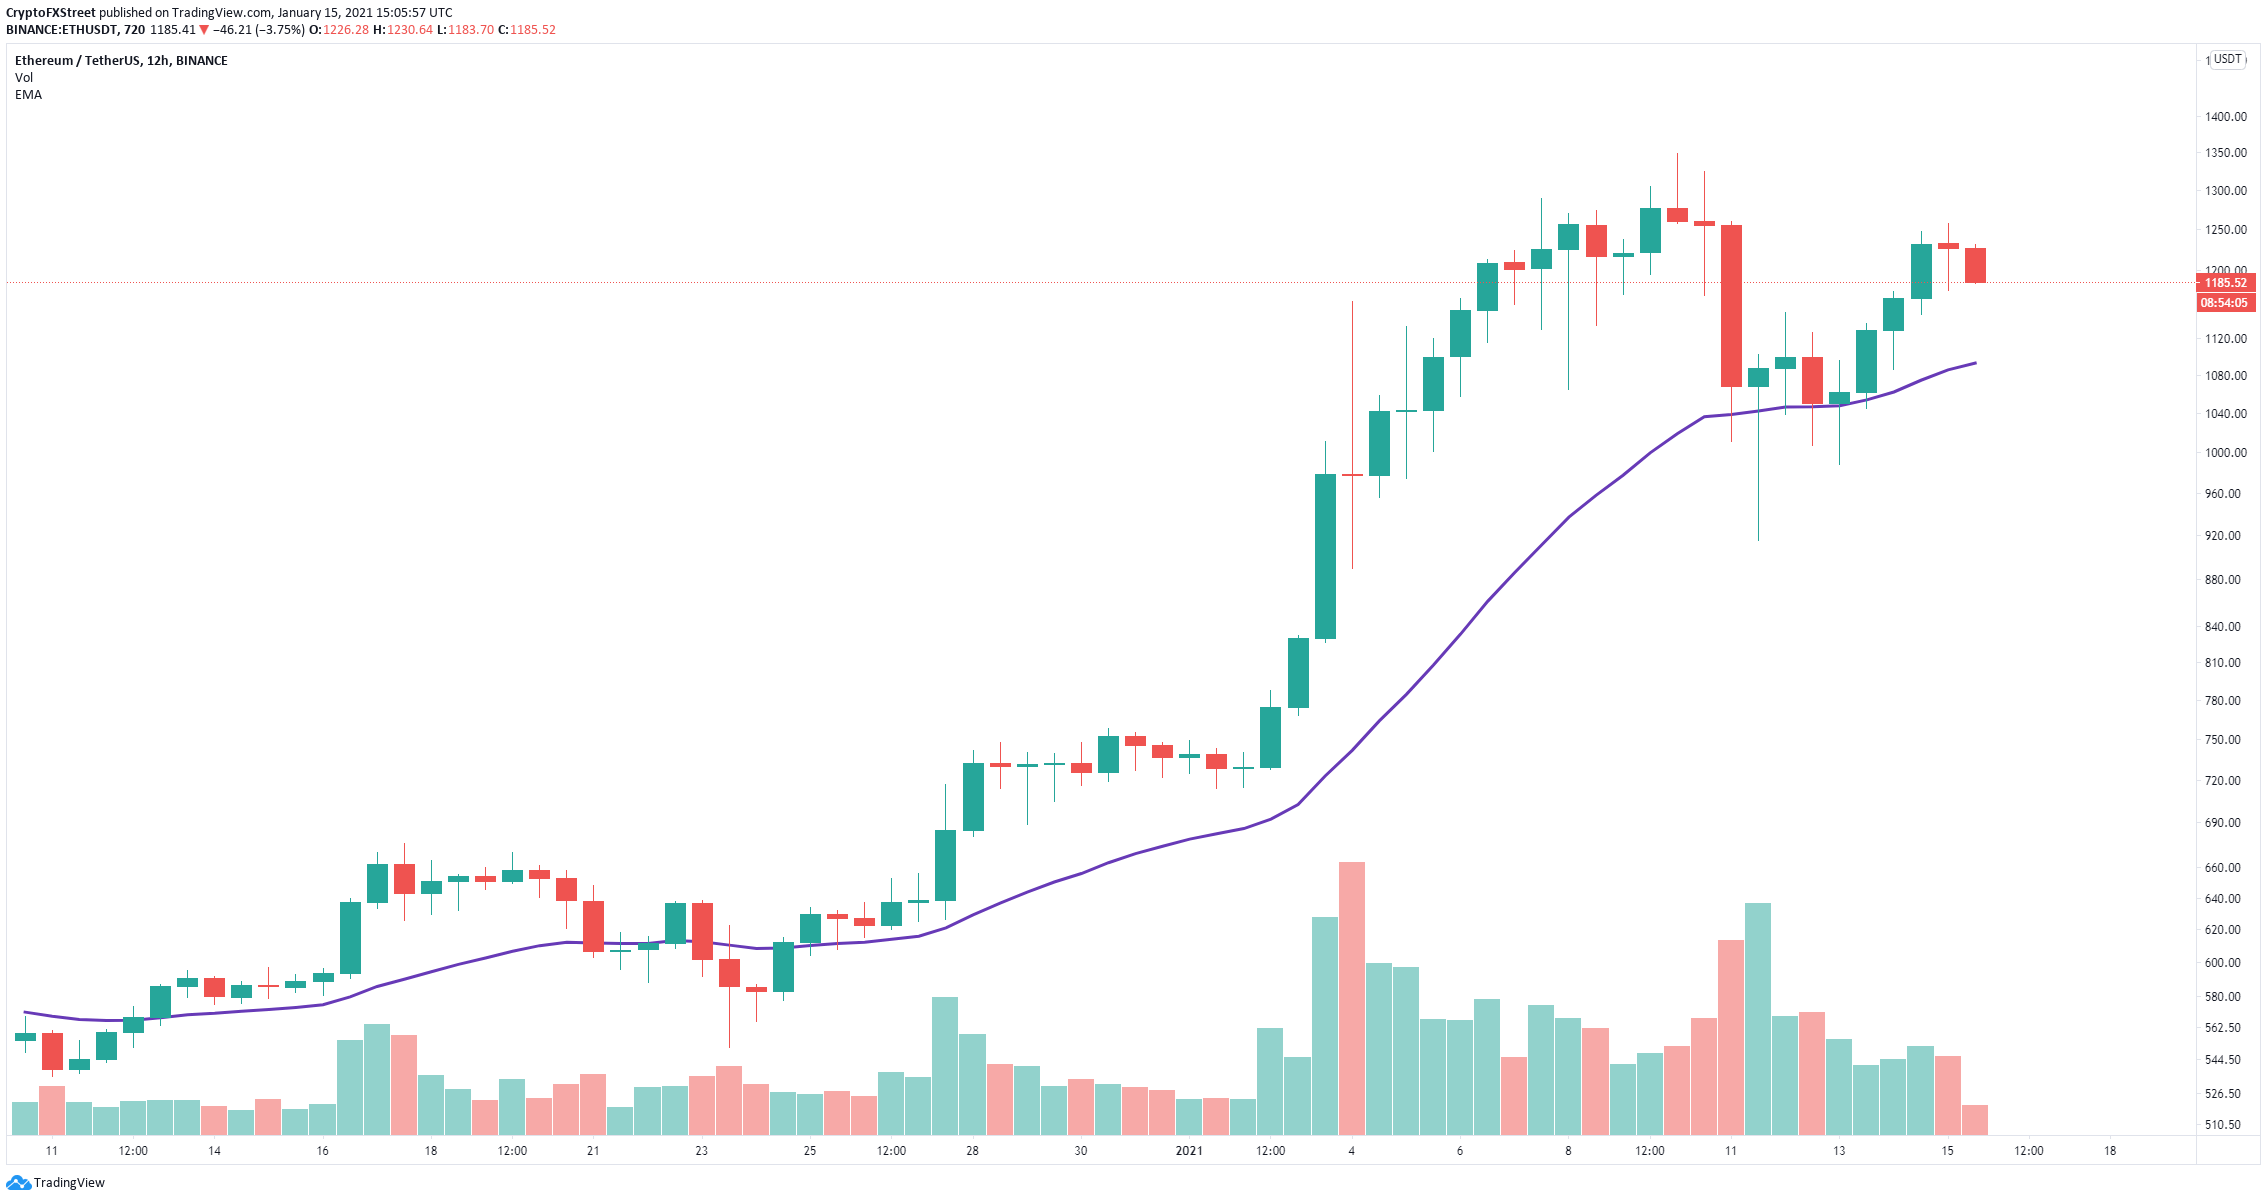
ETH/USD 12-hour chart
On the 12-hour chart, Ethereum price seems to be on the verge of establishing a lower high compared to $1,348. The bears could push it down to $1,100 where the 26-EMA is currently located, creating an equilibrium pattern.
Author

Lorenzo Stroe
Independent Analyst
Lorenzo is an experienced Technical Analyst and Content Writer who has been working in the cryptocurrency industry since 2012. He also has a passion for trading.


