Ethereum price 20% October rally inspires increased investor confidence, ETH supply on exchanges decreases
- Ethereum price is up almost 20% from the October 12 low of $1,523, drawing investors back to the scene.
- Santiment data shows dwindling ETH supply on exchanges, suggesting an intention to hold.
- Increased buying pressure could send the altcoin 5% north, clearing the immediate barrier as the $1,900 psychological level looms.
- A daily candlestick close below $1,748 would invalidate the bullish thesis.

Ethereum (ETH) price continues to hold above a crucial support level after a significant climb beginning in mid-October. The second largest cryptocurrency by market capitalization may have more gusto to move north, based on technical fundamentals, with data indicating a renewed investor confidence for ETH.
Also Read: Ethereum Price Prediction: ETH needs to hold these key levels to revisit $2,000
Ethereum price likely to climb further as investors flock the scene
Ethereum (ETH) is bullish, boasting a 20% surge in the month of October alone. In the last 24 hours, the largest altcoin by market capitalization is up 0.11% with a trading volume increase of almost 90%. Increased buying pressure could see the cryptocurrency extend north, shattering the immediate roadblock at $1,856 before tagging the $1,900 level.
In a highly bullish case, the gains could extend for Ethereum price to revisit the forecasted $2,000 psychological level. Such a move would constitute a 10% climb above current levels.
Technical indicators showing momentum, including the Relative Strength Index (RSI) and the Awesome Oscillator (AO) support the case to the upside, showing that bulls have their best food forward. The RSI remains northbound, holding above the 70 level to show bulls have more action in the cards for Ethereum price. Similarly, the AO is in the positive territory as bulls head the market.
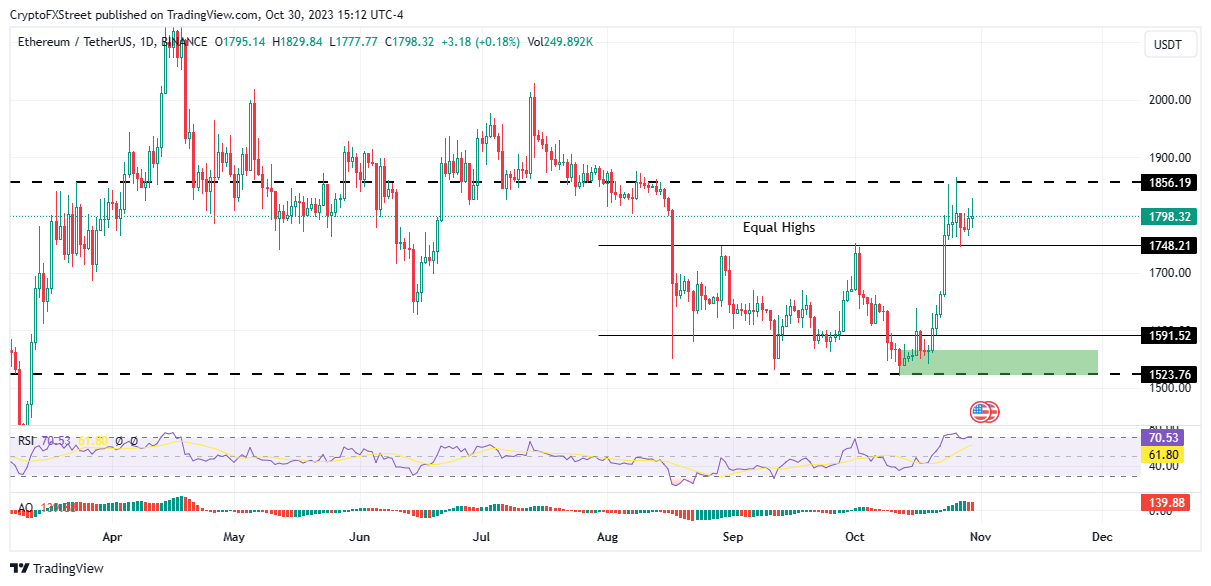
ETH/USDT 1-day chart
Ethereum FAQs
What is Ethereum?
Ethereum is a decentralized open-source blockchain with smart contracts functionality. Serving as the basal network for the Ether (ETH) cryptocurrency, it is the second largest crypto and largest altcoin by market capitalization. The Ethereum network is tailored for scalability, programmability, security, and decentralization, attributes that make it popular among developers.
What blockchain technology does Ethereum use?
Ethereum uses decentralized blockchain technology, where developers can build and deploy applications that are independent of the central authority. To make this easier, the network has a programming language in place, which helps users create self-executing smart contracts. A smart contract is basically a code that can be verified and allows inter-user transactions.
What is staking?
Staking is a process where investors grow their portfolios by locking their assets for a specified duration instead of selling them. It is used by most blockchains, especially the ones that employ Proof-of-Stake (PoS) mechanism, with users earning rewards as an incentive for committing their tokens. For most long-term cryptocurrency holders, staking is a strategy to make passive income from your assets, putting them to work in exchange for reward generation.
Why did Ethereum shift from Proof-of-Work to Proof-of-Stake?
Ethereum transitioned from a Proof-of-Work (PoW) to a Proof-of-Stake (PoS) mechanism in an event christened “The Merge.” The transformation came as the network wanted to achieve more security, cut down on energy consumption by 99.95%, and execute new scaling solutions with a possible threshold of 100,000 transactions per second. With PoS, there are less entry barriers for miners considering the reduced energy demands.
ETH sees increased investor confidence, Santiment data shows
Data according to behavior analytics platform Santiment shows investor confidence for ETH is increasing. As indicated in the chart below, there is decreasing Ethereum supply on exchanges, which shows that investors’ selling appetite has dwindled even as the altcoin’s price continues to rise. It shows investors are willing to ride the rally rather than booking early profits. Secondly, ETH is also recording increased social dominance as investors are enthused with the uptrend in Ethereum price.
 [23.57.00, 30 Oct, 2023]-638342989943753587.png)
ETH Social dominance, supply on exchanges
Lastly, the proof-of-stake token is also recording a growing market capitalization for the Tether (USDT) stablecoin, a move often attributed to new money flowing in or capital inflow as investors look to buy ETH.
 [00.22.28, 31 Oct, 2023]-638342990209423462.png)
USDT market capitalization
On the other hand, a subsequent rejection from the $1,856 could see Ethereum price drop, possibly going as low as to lose critical support offered by the $1,748 level. A decisive daily candlestick close below this level would invalidate the bullish thesis.
In the dire case, such a move could plunge Ethereum price back into the grasp of the consolidation phase extending below the $1,700 psychological level to $1,591. The worst case scenario could see ETH drop to tag the $1,523 support floor.
Based on Santiment’s Market Value to Realized Value (MVRV) ratio, over a 30-day period, Ethereum price is now in a “danger zone.” This metric measures the short-term profit/loss of holders and currently shows that we have reached the peak since October 21. In the past, a foray above this level saw short-term holders who are well in profit cash in for early gains. The danger zone can also be referred to as a “historical sell zone.”
 [00.12.44, 31 Oct, 2023]-638342990319318493.png)
ETH MVRV
Broadly, when the MVRV shows elevated values, it means there is a high level of unrealized profit. Consequently, the risk of investors selling their holdings for profit it high. In the same way, a low MVRV points to a small level of unrealized profits possibly indicating that an asset is undervalued or is experiencing low demand.
Author

Lockridge Okoth
FXStreet
Lockridge is a believer in the transformative power of crypto and the blockchain industry.


