• Binance research published an overview report on the state of the cryptocurrency market.
  • ETH/USD is locked in a tight range with a bullish bias.

Ethereum, the second-largest digital asset with the current market value of $18.4 billion, has lost nearly 1% since the beginning of Wednesday and stayed unchanged on a day-to-day basis. ETH/USD attempted a rise above $171.00, but the move proved to be unsustainable and the coin slipped back below $170.00 level.

Ethereum has the strongest correlation

According to the findings revealed in the latest Binance research paper, the cryptocurrency universe is moving towards a tighter correlation between various assets; however, Ethereum has the highest correlation with the rest of the market with the coefficient of 0.69. The least correlated are  Cosmos (0.31), Chainlink and Tezos (0.32 and 0.4 respectively).

Also, the researches pointed out that the correlation tends to grow during bearish markets.

As a general rule, a correlation above 0.5 or below -0.5 is considered strong, while a value close to zero means that the assets move independently and have no or very little linear relationship. 

The research showed that correlations between all pairs are always positive.

The most significant insight is that the largest change in asset correlations occurred in the third quarter of 2019. Based on manual inspection of the correlation matrices, this indicates that assets might be stronger correlated with each other in adverse market movements of the price. Coherently, crypto assets are less correlated with each other in up- or sidewards movements. Further analysis over a more extended period could substantiate this finding.

ETH/USD: technical picture

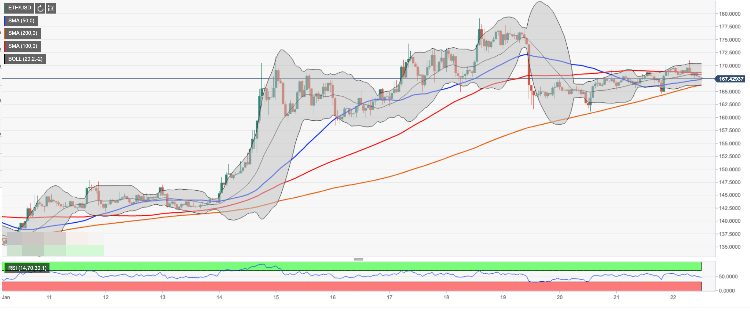
On the intraday charts, ETH/USD is moving within a tight upside channel with the upper boundary created by the upper line of 1-hour Bollinger Band above $170.00. A sustainable move above this barrier will open up the way towards $179.00-$180.00 resistance area. Once it is out of the way, the upside is likely to gain traction with the next focus on psychological $180.00 reinforced by SMA200 daily and the upper line of daily Bollinger Band. 

On the downside, keep an eye on the lower boundary of the above-mentioned range created at $166.00 by SMA200 1-hour and reinforced by the lower line of 1-hour Bollinger Band. If it is broken, the sell-off may continue towards his week's low at $161.11 followed by psychological $160.00.

ETH/USD 1-hour chart


Note: All information on this page is subject to change. The use of this website constitutes acceptance of our user agreement. Please read our privacy policy and legal disclaimer. Opinions expressed at FXstreet.com are those of the individual authors and do not necessarily represent the opinion of FXstreet.com or its management. Risk Disclosure: Trading foreign exchange on margin carries a high level of risk, and may not be suitable for all investors. The high degree of leverage can work against you as well as for you. Before deciding to invest in foreign exchange you should carefully consider your investment objectives, level of experience, and risk appetite. The possibility exists that you could sustain a loss of some or all of your initial investment and therefore you should not invest money that you cannot afford to lose. You should be aware of all the risks associated with foreign exchange trading, and seek advice from an independent financial advisor if you have any doubts.

Join Telegram

Recommended content


Recommended Content

Editors’ Picks

Ethereum dips slightly amid Renzo depeg, BlackRock spot ETH ETF amendment

Ethereum dips slightly amid Renzo depeg, BlackRock spot ETH ETF amendment

Ethereum (ETH) suffered a brief decline on Wednesday afternoon despite increased accumulation from whales. This follows Ethereum restaking protocol Renzo restaked ETH (ezETH) crashing from its 1:1 peg with ETH and increased activities surrounding spot Ethereum ETFs.

More Ethereum News

Injective price weakness persists despite over 5.9 million INJ tokens burned

Injective price weakness persists despite over 5.9 million INJ tokens burned

Injective (INJ) price is trading with a bearish bias, stuck in the lower section of the market range. The bearish outlook abounds despite the network's deflationary efforts to pump the price. Coupled with broader market gloom, INJ token’s doomed days may not be over yet.

More Injective News

US intensifies battle against crypto privacy protocols following crackdown on Samourai Wallet

US intensifies battle against crypto privacy protocols following crackdown on Samourai Wallet

CEO Keonne Rodriguez and CTO William Lonergan of Samourai Wallet were arrested by the US Department of Justice (DoJ) on Wednesday and charged with $100 million in money laundering on a count and illegal money transmitting on another count. This move could see privacy-focused cryptocurrencies take a dip.

More Cryptocurrencies News

Near Protocol Price Prediction: NEAR fulfills targets but a 10% correction may be on the horizon

Near Protocol Price Prediction: NEAR fulfills targets but a 10% correction may be on the horizon

Near Protocol price has completed a 55% mean reversal from the bottom of the market range at $4.27. Amid growing bearish activity, NEAR could drop 10% to the $6.00 psychological level before a potential recovery. A break and close above $7.95 would invalidate the downleg thesis.

More Near Protocol News

Bitcoin: BTC post-halving rally could be partially priced in Premium

Bitcoin: BTC post-halving rally could be partially priced in

Bitcoin (BTC) price briefly slipped below the $60,000 level for the last three days, attracting buyers in this area as the fourth BTC halving is due in a few hours. Is the halving priced in for Bitcoin? Or will the pioneer crypto note more gains in the coming days? 

Read full analysis

BTC

ETH

XRP