|

Ethereum $ETH/USD forecasting the rally from the equal legs zone

In this article we’re going to take a quick look at the Elliott Wave charts of Ethereum published in members area of the website.  As our members know ETHUSD is trading within the cycle from the June 2022 low. Consequently we expect to see more short term strength.  Recently Ethereum made a pull back that has reached target area and found buyers as expected.  In the further text we are going to explain the Elliott Wave Forecast.

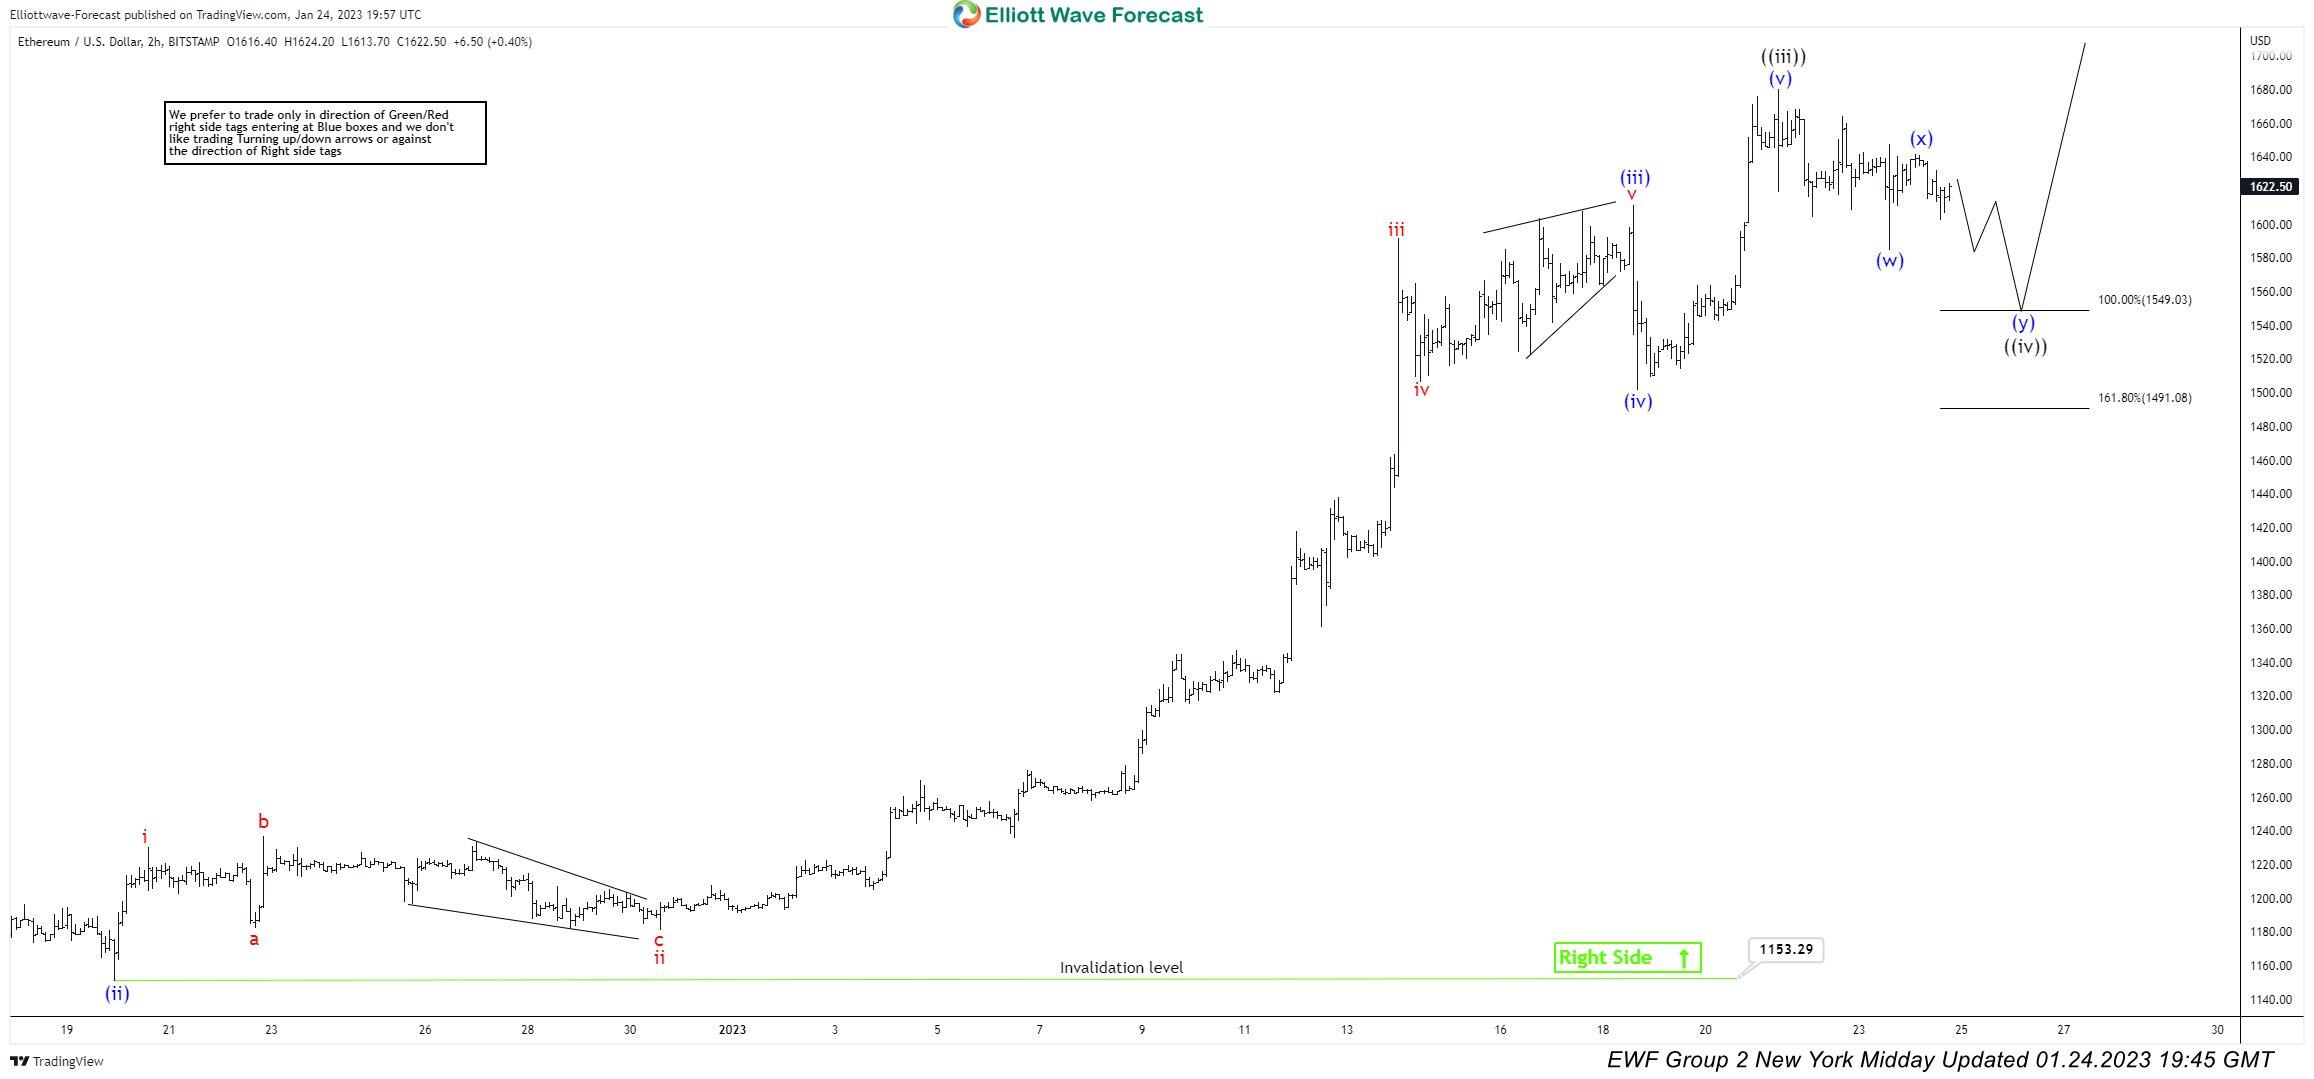
ETH/USD Elliott Wave 1 hour chart 01.24.2023

Ethereum is showing impulsive bullish sequences in the cycle from the November 2022 low. Consequently we expect to see a further rally. Currently Ethereum is doing wave ((iv)) pull back which still looks incomplete at the moment. Pull back is shallow so far, so we assume ETHUSD ended only first leg (w) of ((iv)) that is unfolding as potential double three pattern. We believe  Wave (y) blue is still in progress toward 1549-1491 area. Buyers should ideally appear at the marked zone for the further rally toward new high ideally or for a 3 waves bounce at least.

Ethereum

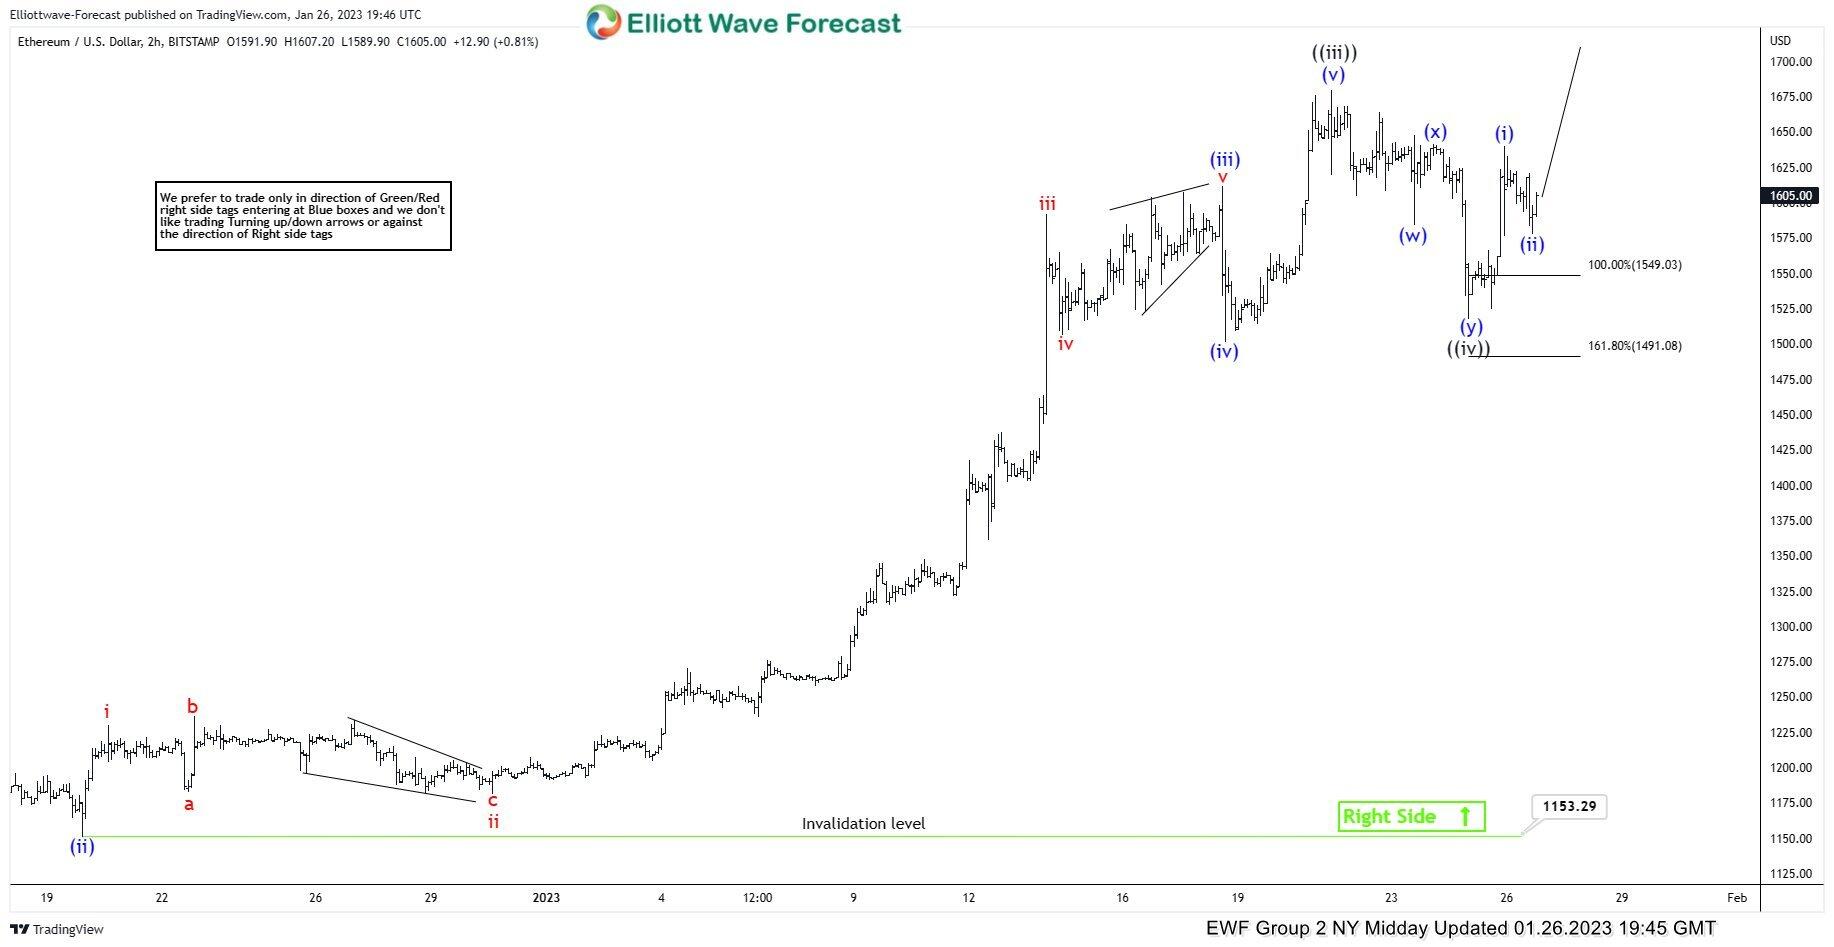
ETH/USD Elliott Wave 1 hour chart 01.26.2023

Pull back reached our target zone at 1549-14914 (equal legs : buyers area). Ethereum found buyers at that zone and we are getting very good reaction from there. Rally made enough separation from the lows. As a result, any longs from there should be risk free already and partial profit taken.  Wave ((iv)) looks to be completed at 1516.2 low . Now, we should be ideally trading within wave ((v)) toward 1719+ area.

Ethereum

Author

Elliott Wave Forecast Team

Elliott Wave Forecast Team

ElliottWave-Forecast.com

More from Elliott Wave Forecast Team
Share:

Editor's Picks

XRP struggles to hold modest gains as risk-off mood caps upside

Ripple (XRP) hovers above $1.15 on Tuesday, following a rejection near $1.20. The remittance token mirrors the broader risk-off mood, with Bitcoin (BTC) stalling around $63,000 and Ethereum (ETH) trading below $1,700.

Crypto Today: Bitcoin, Ethereum, XRP edge lower despite Middle East tensions easing

Cryptocurrency prices trade amid persistent selling pressure on Tuesday. Bitcoin (BTC) hovers near $63,000, Ethereum (ETH) above $1,650, and Ripple (XRP) around $1.14.

Venice risks bearish reversal amid easing demand and revenue

Venice holds near $16 on Tuesday, extending consolidation after correcting from all-time highs last week. On-chain data show a decline in token staking and burning amid a declining revenue stream, suggesting weaker demand.

Bitcoin Price Forecast: Persistent ETF outflows continue to limit recovery

Bitcoin trades slightly lower on Tuesday after struggling to hold above $64,000, a level that coincides with key daily resistance. Risk sentiment improved slightly after Iran and Israel halted a military escalation following an exchange of strikes.

Bitcoin: After the bloodbath, everyone looks at $60,000
Bitcoin (BTC) hovers above $62,000 at the time of writing on Friday, weighed down by growing risk-off sentiment due to persistent geopolitical tensions in the Middle East and sticky macroeconomic uncertainty. The institutional sell-off continued to wreak havoc on capital flows, with spot Bitcoin Exchange-Traded Funds (ETFs) recording billions in outflows.