|

Ethereum (ETH/USD) Elliott Wave: Forecasting the rally from equal legs zone

In this technical article, we are going to present Elliott Wave charts of Ethereum ETHUSD. As our members know, ETHUSD has been showing impulsive bullish sequences in the cycle from the 2,118.6 low, pointing to further strength ahead. We have been calling for a rally in ETHUSD since the beginning of July, based on the higher high bullish sequences the crypto was forming. Recently we got an intraday pullback labeled wave ((iv)), which landed right in the equal‑legs zone. In the following section, we’ll explain our Elliott Wave count and present the target area for wave ((v))

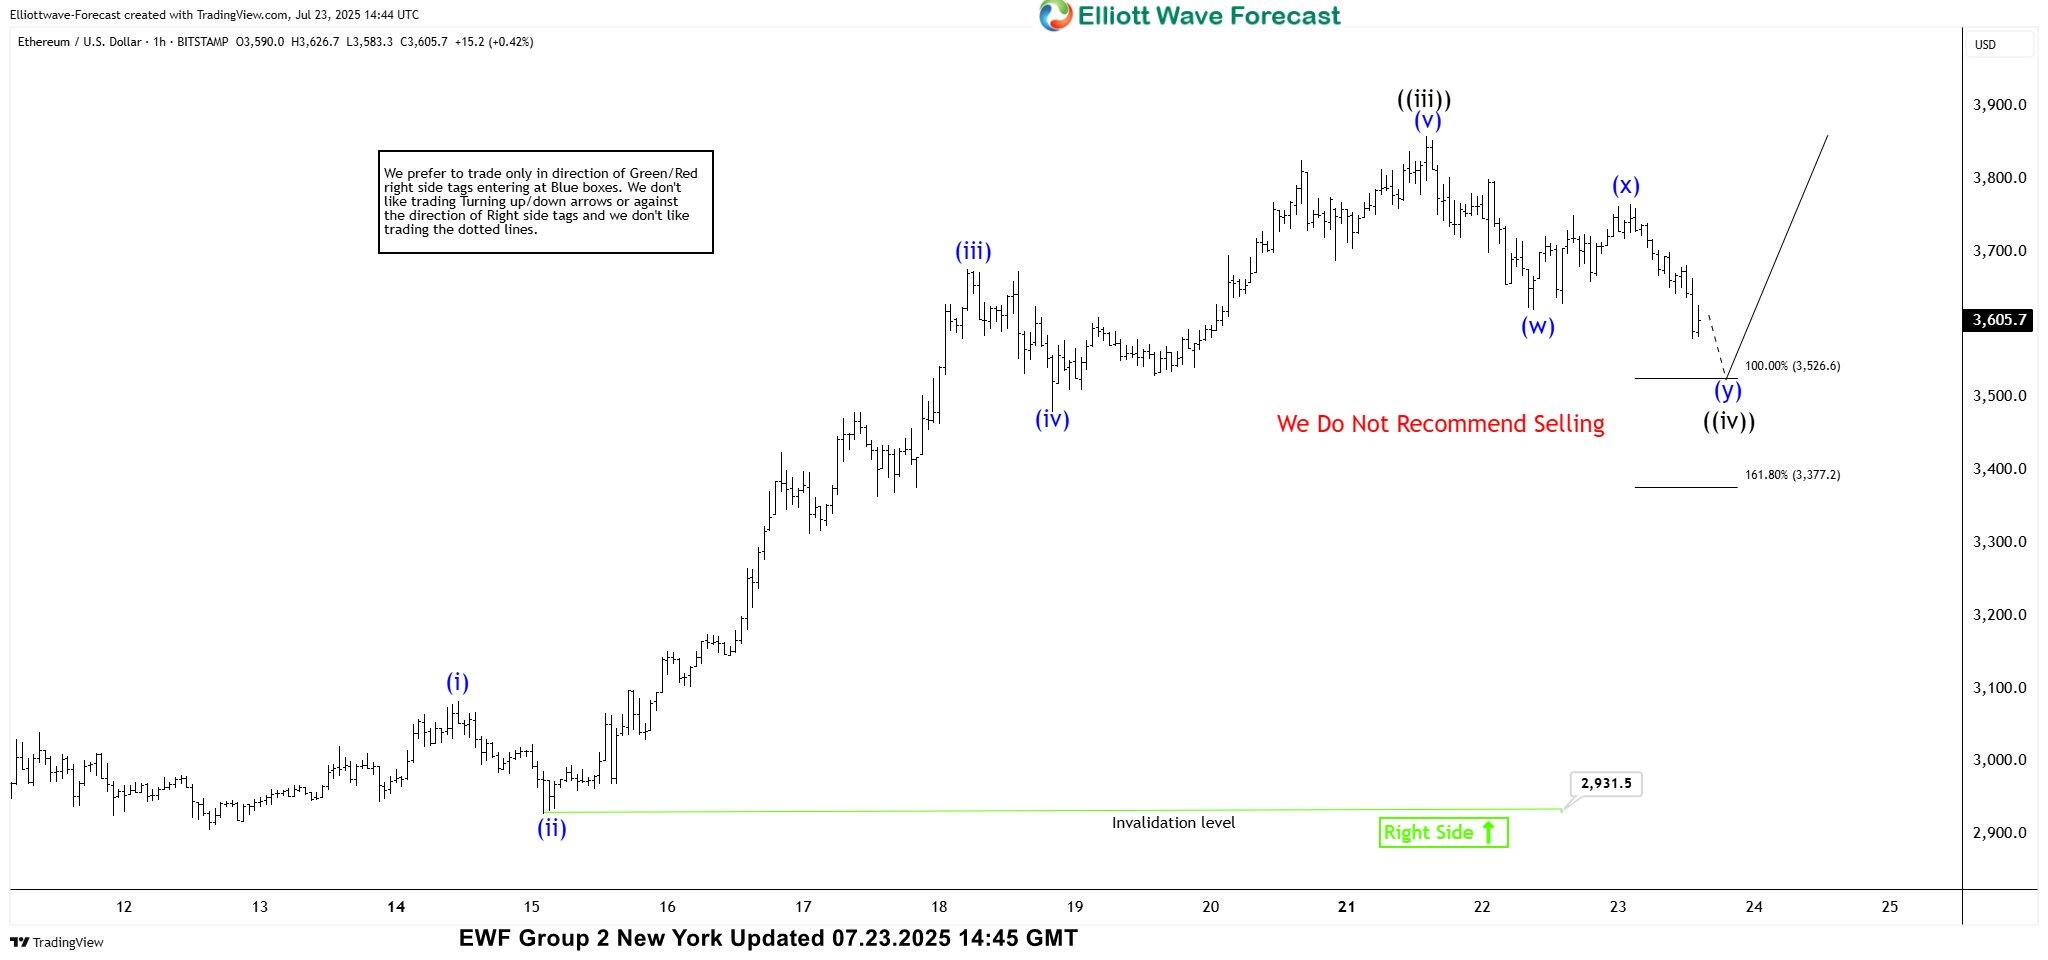
ETH/USD Elliott Wave one-hour chart 07.23.2025

ETH/USD is currently doing wave ((iv)) black pull back. The correction appears incomplete at this stage. We anticipate further short-term weakness toward the Equal Legs area at 3,526.6-3,377.2. In that zone, we expect buyers to emerge and initiate another rally toward new highs. Therefore, we recommend avoiding short positions within this area.

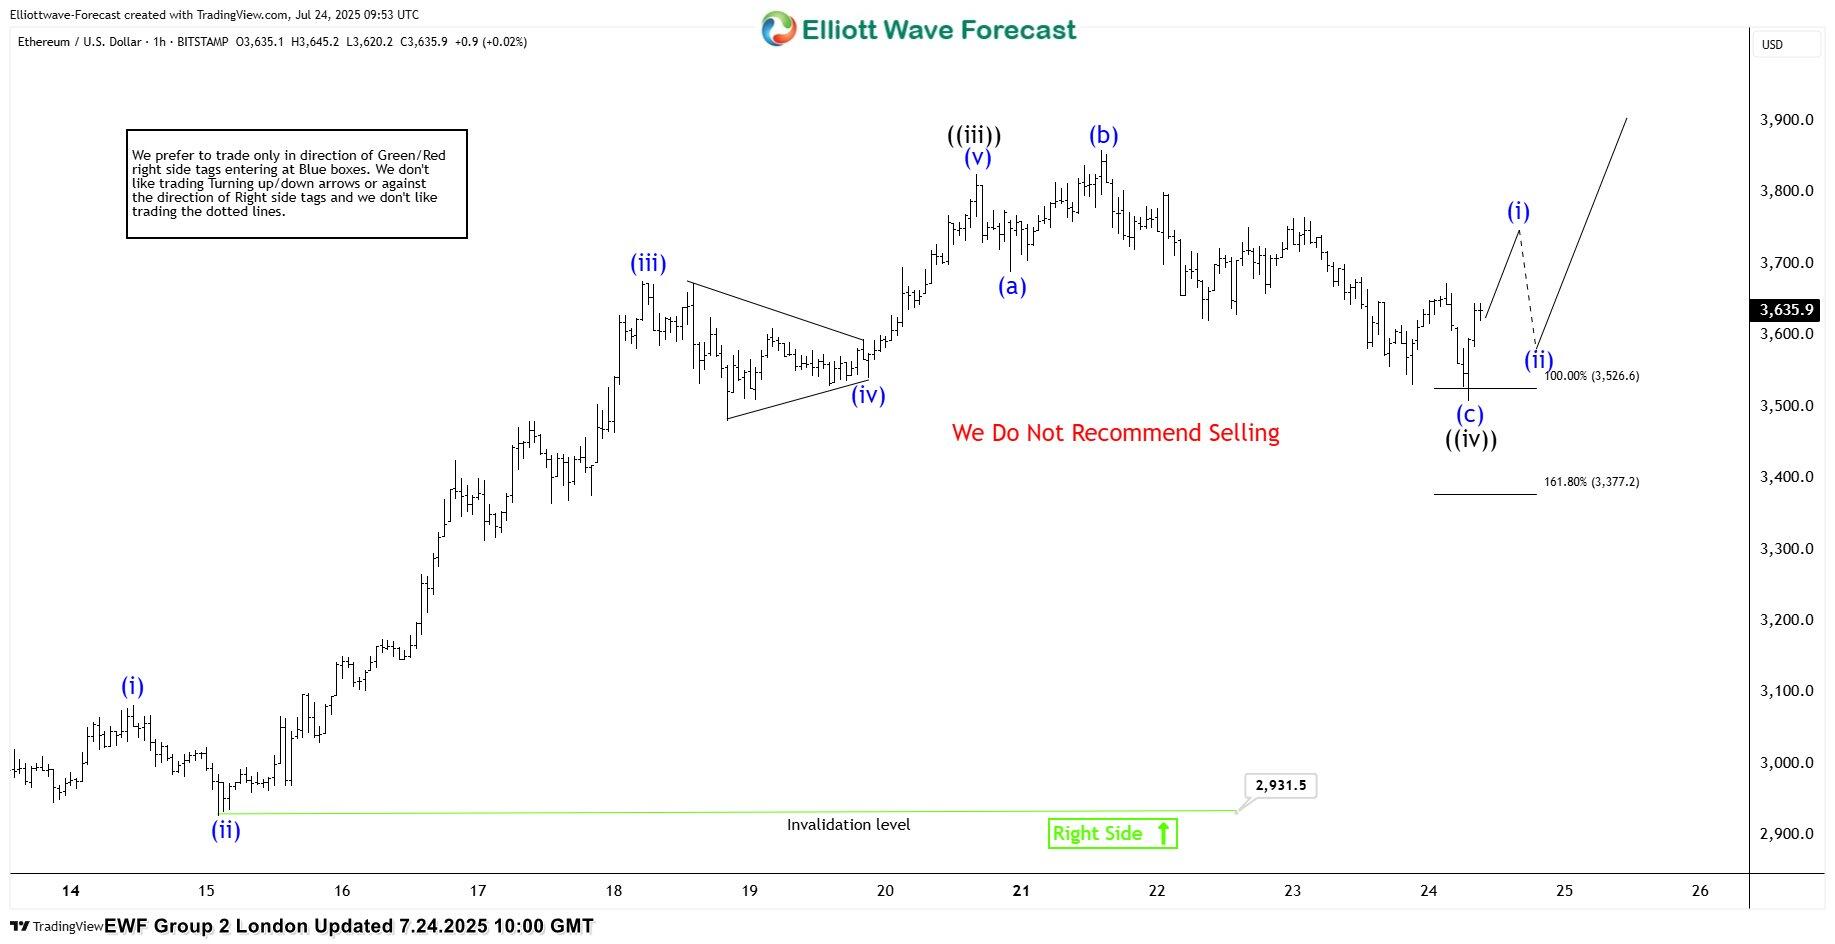
ETH/USD Elliott Wave one-hour chart 07.24.2025

The price extended downward into the marked equal legs area, where ETHUSD found buyers as expected and has already shown a reaction. At this stage, we count the pullback as wave ((iv)), completed at the 3,510 low. As long as price remains above that level, we are likely in wave ((v)), targeting the 3,943–4,077 zone. Alternatively, if the 3,510 low is broken before a new high is made, we’ll likely see a deeper pullback. In that case, we’ll measure a new equal‑legs zone to identify the next buying area.

Author

Elliott Wave Forecast Team

Elliott Wave Forecast Team

ElliottWave-Forecast.com

More from Elliott Wave Forecast Team
Share:

Editor's Picks

Top 3 Price Prediction: Bitcoin, Ethereum, and Ripple face downside risk as bears regain control

Bitcoin, Ethereum, and Ripple remain under pressure on Wednesday, with the broader trend still sideways. BTC is edging below $68,000, nearing the lower consolidating boundary, while ETH and XRP also declined slightly, approaching their key supports.

Cardano Price Forecast: ADA stalls as mixed signals limit recovery

Cardano steadies at $0.28 on Wednesday after failing to break through a key resistance zone over the weekend. Mixed signals from the derivatives and on-chain metrics suggest that ADA’s short-term outlook remains uncertain, limiting the scope for a recovery.

Pi Network Price Forecast: PI rally defies market pressure ahead of its first anniversary

Pi Network is trading above $0.1900 at press time on Wednesday, extending the weekly gains by nearly 8% so far. The steady recovery is supported by a short-term pause in mainnet migration, which reduces pressure on the PI token supply for Centralized Exchanges.

Top Crypto Gainers: Jito drops, Morpho holds steady, Convex Finance climbs

Decentralized Finance (DeFi) tokens, including Jito, Morpho, and Convex Finance, rank among the top-performing crypto assets over the last 24 hours. Jito dips on Wednesday after rallying 22% the previous day on the launch of a new mainnet node.

Bitcoin Price Annual Forecast: BTC holds long-term bullish structure heading into 2026

Bitcoin (BTC) is wrapping up 2025 as one of its most eventful years, defined by unprecedented institutional participation, major regulatory developments, and extreme price volatility.

Bitcoin: BTC bears aren’t done yet

Bitcoin (BTC) price slips below $67,000 at the time of writing on Friday, remaining under pressure and extending losses of nearly 5% so far this week.