Ethereum (ETH) Price Analysis: ETH/USD crashes out from pennant pattern
- ETH/USD remains down a chunky 12% in the late part of trading on Wednesday.
- A bearish pennant pattern was firmly broken on the daily chart view. This has left the door open for bears to capitalize on.

The Ethereum price late on Wednesday, was still nursing sizeable losses, down over 12% in the session. Following the heavy selling pressure that hit the market, rippling across all of the top altcoins, resulting in key support areas being breached.
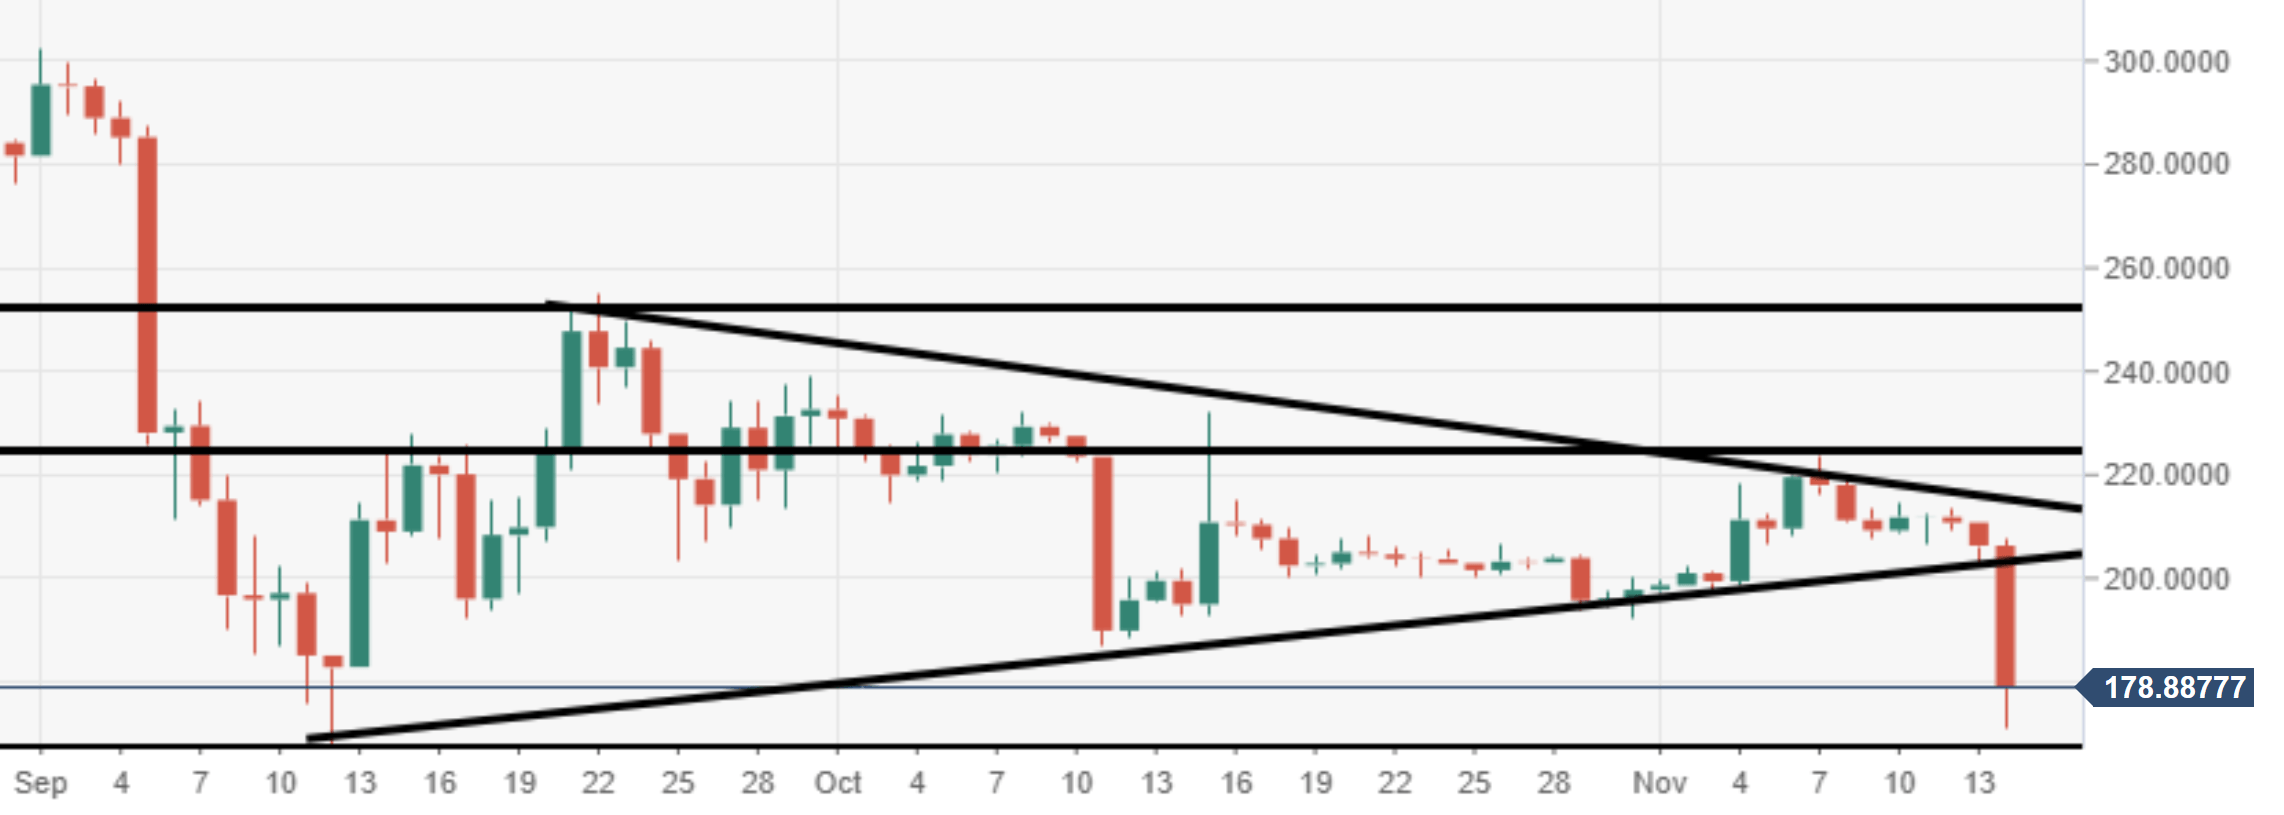
ETH/USD price action had initially formed a bearish pennant pattern. The shaping up of this started towards the back-end of September. Given the firm piercing of the lower trend line, it has left the door open to further downside pressure.
Technically, eyes are on to see how the price reacts to 12th September low, $168. This is where the market commenced a decent rebound, going on to move above $250. A failure to hold at the mentioned support, could see a fast fall down to just below $140, traded here back in July 2017. Should the price manage to catch a bounce, a possible retest of the breached pennant could be observed, before a resumption to the downside.
ETH/USD daily chart
Author

Ken Chigbo
Independent Analyst
Ken has over 8 years exposure to the financial markets. He started his career as an analyst, covering a variety of asset classes; forex, fixed income, commodities and equities.


